Introduction
Every B2B sales pipeline contains hidden revenue. Deals that should close, but don’t—because sales teams miss the moment when prospects are ready to buy.
The cost? Substantial. According to Gartner’s 2024 B2B Buying Journey Study, 87% of buying signals go completely unnoticed by vendors. Meanwhile, Velocify’s analysis of over 15 million leads shows that companies responding to buying signals within one minute achieve a 391% higher conversion ratecompared to those waiting 30 minutes.
Simple math: 78% of customers purchase from the vendor who responds first. Organizations that systematically detect and respond to buying signals don’t just compete—they dominate. Research confirms effective signal use generates 10-20% more sales opportunities while cutting customer acquisition costs by up to 30%.
This guide provides a framework for identifying, scoring, and responding to buying signals across the entire buyer journey.
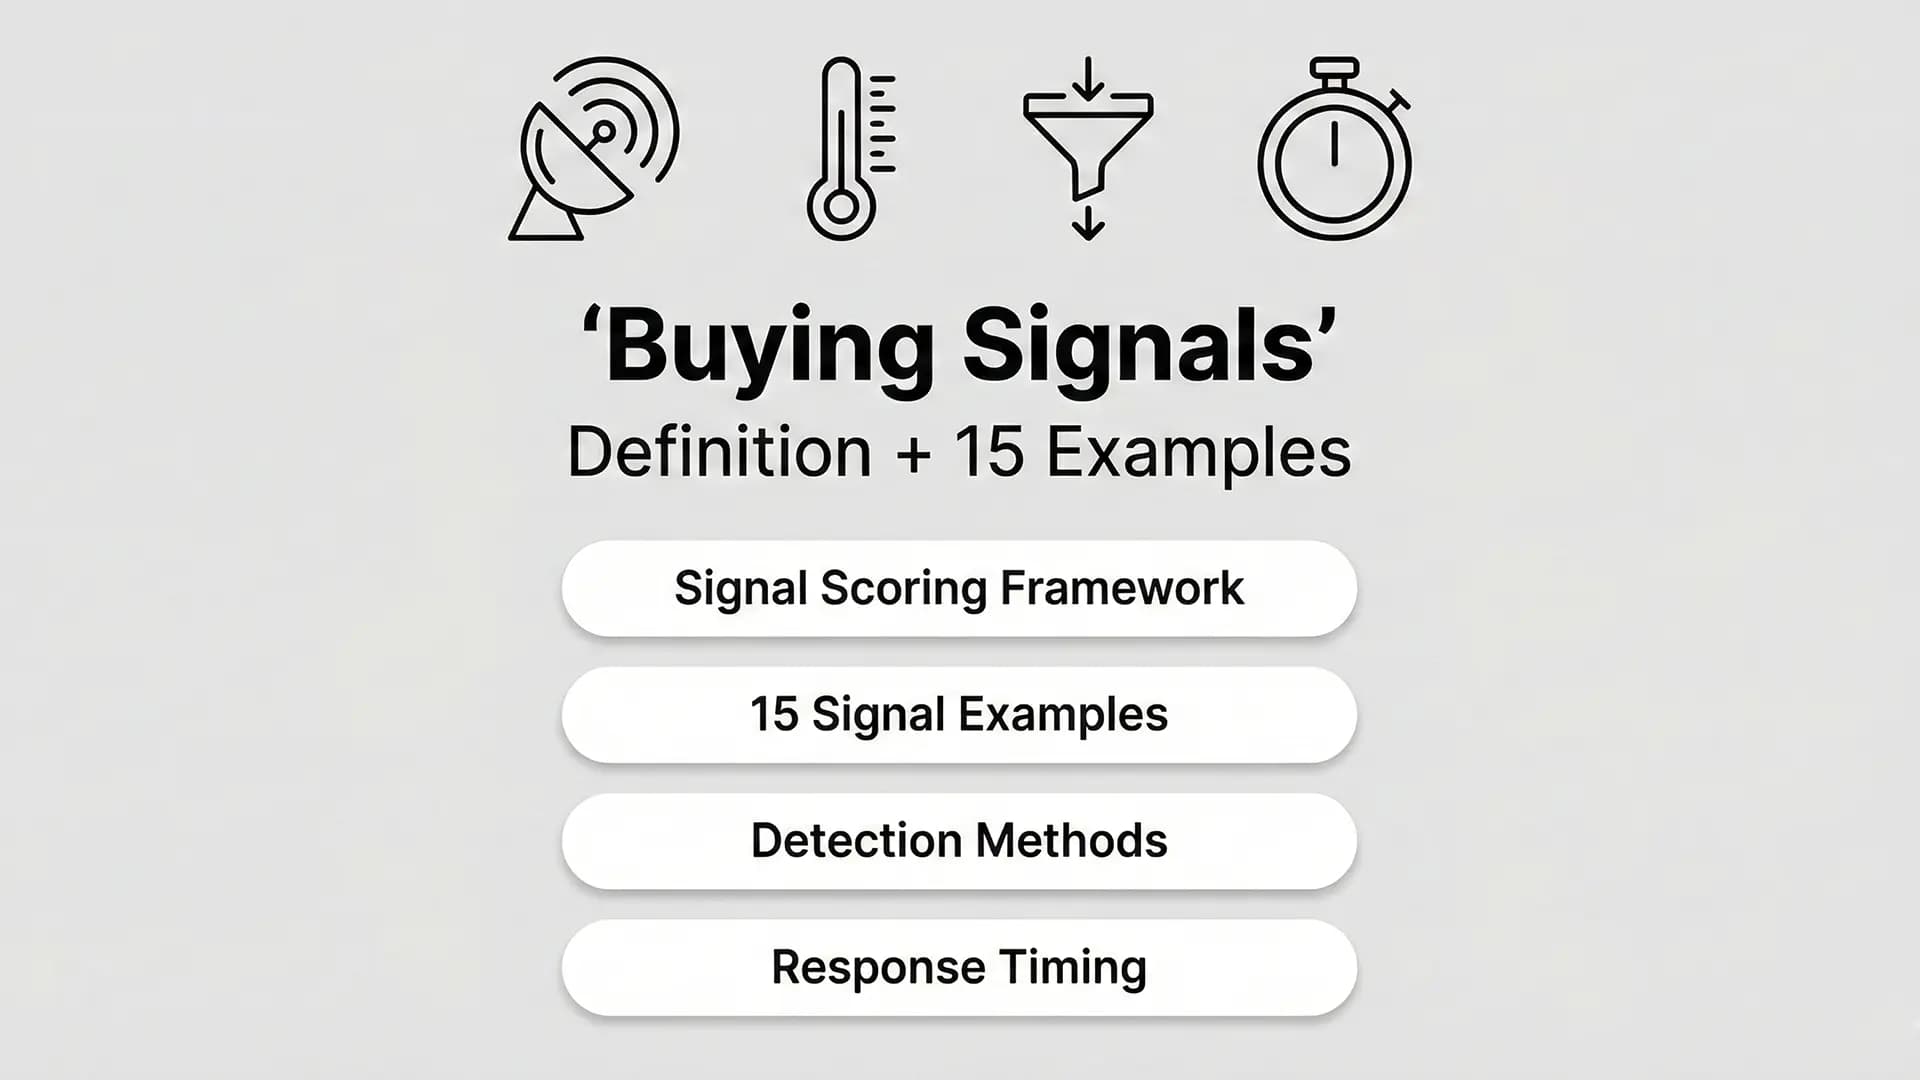
What Are Buying Signals?
A buying signal is any action, statement, or behavior indicating a prospect is actively considering a purchase.
Signals fall into three categories:
Verbal Signals — Direct statements revealing purchase intent during conversations: - “What’s your pricing for our team size?” - “How long does implementation typically take?” - “Can you integrate with our current stack?”
Behavioral Signals — Observable actions during sales interactions: - Taking detailed notes during demonstrations - Inviting additional stakeholders to calls - Asking to record meetings for internal review
Digital Signals — Online behavior patterns indicating research and evaluation: - Repeated pricing page visits - Case study downloads - Product comparison searches
Why this matters now: According to research, 77% of B2B buyers complete their research before contacting sales—meaning 70% of the buying process unfolds invisibly. Modern AI tools can now detect signals before prospects fill out forms, analyzing behavioral patterns to predict intent. Organizations implementing systematic signal tracking gain visibility into this previously hidden journey.
Buying Signals vs Intent Data
Understanding the distinction between first-party signals and third-party intent data shapes detection strategy.
First-party buying signals come from direct interactions with owned properties—website behavior, email engagement, product trials, sales conversations. These signals carry higher accuracy because they reflect specific interest in your solution.
Third-party intent data aggregates signals from external sources—industry publications, review sites like G2, content syndication networks. This data indicates category research but doesn’t confirm interest in your organization specifically.
| First-Party Signals | Third-Party Intent Data |
|---|---|
| Website and product behavior | Cross-web research patterns |
| Direct engagement metrics | Review site activity |
| Higher accuracy | Broader market coverage |
Strategic approach: Prioritize first-party signals for immediate action. Layer third-party intent data to identify accounts entering the market before they visit your properties.
Signal Scoring: Prioritizing Response
Not all signals warrant equal urgency. A whitepaper download and a demo request? Fundamentally different intent levels.

The Signal Scoring Framework
Score 1-3: Awareness Stage - Purchase timeline: 6-12 months - Response: Automated nurture sequence - Conversion probability: 2-7%
Score 4-6: Consideration Stage - Purchase timeline: 3-6 months - Response: Personalized outreach within 24 hours - Conversion probability: 22-44%
Score 7-10: Decision Stage - Purchase timeline: Days to 4 weeks - Response: Immediate (within 5 minutes) - Conversion probability: 45-78%
The 391% conversion advantage applies specifically to high-scoring signals (7-10) with rapid response. Applying aggressive outreach to Score 2 signals damages prospect relationships—context matters.
15 Buying Signal Examples

Awareness Stage (Score 1-3)
1. Content Engagement Score: 2 | Conversion: 3% The prospect reads blog posts or engages with educational content. They’re researching the problem space, not evaluating solutions. Response: Add to nurture sequence with related content.
2. Newsletter Subscription Score: 2 | Conversion: 4-6% Subscribing indicates ongoing interest but low immediate intent. Response: Welcome sequence focused on value delivery.
3. Social Media Engagement Score: 2 | Conversion: 2-4% Likes or comments on company posts show brand awareness without purchase intent. Response: Nurture only—no direct sales outreach.
4. Leadership Change at Target Account Score: 3 | Conversion: 5% New executives typically allocate 70% of discretionary budget within their first 100 days. Response: Personalized outreach 30-90 days after appointment.
5. Funding Announcement Score: 3 | Conversion: 6% Recent funding indicates budget availability and growth investment. Response: Research-backed outreach connecting your solution to their announced priorities.
Consideration Stage (Score 4-6)
6. Multiple Page Visits Score: 5 | Conversion: 27% Visiting 5+ pages in a single session indicates active evaluation. Response: Personalized email within 24 hours referencing specific pages viewed.
7. Case Study Downloads Score: 6 | Conversion: 38% Downloading multiple case studies signals proof-seeking behavior—they’re building internal justification. Response: Sales outreach within 12 hours with relevant customer story.
8. Repeated Email Engagement Score: 5 | Conversion: 16% Opening 3+ emails and clicking 2+ links within two weeks shows sustained interest. Response: Trigger sales development alert for personalized follow-up.
9. Webinar Attendance Score: 6 | Conversion: 42% Investing 30-60 minutes demonstrates serious interest. Attendees who ask questions convert at 61%. Response: Follow up within 4 hours while content remains fresh.
10. Competitor Comparison Research Score: 6 | Conversion: 58% Visiting comparison pages or researching alternatives indicates active vendor evaluation. Response: Provide differentiation content addressing specific competitor weaknesses.
Decision Stage (Score 7-10)
11. Pricing Page Visits (Multiple) Score: 8 | Conversion: 62% Two or more pricing page visits within 48 hours signals budget evaluation and imminent decision. Response: Within 5 minutes. Metadata achieved 81% shorter sales cycles through pricing signal response.
12. Demo Request Score: 9 | Conversion: 78% Explicit request for product demonstration represents highest-intent action. Response: Under 5 minutes. Companies responding within 5 minutes achieve 78% conversion versus 31% for responses exceeding one hour.
13. Trial Activation Score: 8 | Conversion: 71% Users engaging 3+ core features during trial demonstrate genuine evaluation. Response: Immediate onboarding support; sales follow-up within 24 hours.
14. Multiple Stakeholder Engagement Score: 8 | Conversion: 4.1x increase Three or more individuals from the same company visiting within one week indicates buying committee formation. Response: Offer group demonstration or executive briefing.
15. High-Value Action Combination Score: 10 | Conversion: 78% Pricing page + case study + demo request within 48 hours signals imminent purchase decision. Response: Treat as highest priority—immediate executive engagement.
The multi-signal advantage: Single signal = 12% meeting booking rate. Five or more signals = 78%. Signal patterns consistently outperform isolated indicators.
Detecting Buying Signals
Website Visitor Tracking
Track pricing page visits, time on page (2+ minutes indicates serious engagement), repeat visits, and company-level identification. ObserviX provides comprehensive visitor tracking with company identification and automated signal detection—enabling teams to identify high-intent prospects in real-time.
CRM and Marketing Automation
Configure lead scoring models that assign weighted points to each signal type. Track email engagement, form submissions, content downloads, and webinar attendance patterns.
Sales Intelligence Platforms
Monitor job changes, funding announcements, and company expansion signals through platforms like LinkedIn Sales Navigator, ZoomInfo, and UserGems.
Warning Signs: When Signals Turn Negative
Not every interaction indicates buying intent. Recognizing negative signals prevents wasted resources.
Red flags to monitor:
· Ghosting after engagement spike — Intense interest followed by silence indicates friction: pricing concerns, unclear ROI, or competitor influence
· Avoiding decision-maker identification — Reluctance to introduce final decision-makers suggests limited authority or internal resistance
· Repeated rescheduling — Consistently pushing meetings signals deprioritization
· Generic questions only — Lack of specific, implementation-focused questions indicates early research without purchase intent
When to disqualify: If prospects consistently avoid next steps, cannot identify decision-makers, or show no engagement progression over 60+ days, redirect resources to higher-probability opportunities.
Signal Decay: Timing Windows
Buying signals depreciate. A demo request from three months ago carries minimal relevance.
Decay rates by signal type:
| Signal | Action Window | Weekly Decay |
|---|---|---|
| Demo request | 24-72 hours | -8% |
| Pricing page visit | 24-48 hours | -11% |
| Case study download | 1-2 weeks | -5% |
| Content download | 30-60 days | -2% |
Impact example: A pricing page signal starts at 62% conversion probability. With four-week response delay: 38.9% probability—a 37% conversion loss from timing alone.
Response Framework

Conversion Rates by Response Speed
| Response Time | High-Intent (7-10) | Mid-Intent (4-6) |
|---|---|---|
| Under 1 minute | 78% | 42% |
| 5-10 minutes | 62% | 32% |
| 1-24 hours | 21% | 9% |
Response Cadence by Score
| Signal Score | Response Window | Method |
|---|---|---|
| 1-3 | Within 24 hours | Automated nurture |
| 4-6 | Within 4 hours | Personalized email |
| 7-8 | Within 1 hour | Call + email |
| 9-10 | Within 15 minutes | Immediate call |
Cost of Delay
For an organization generating 140 qualified leads monthly at $12K average deal value: - Immediate response: 109 conversions/month - One-hour delay: 53 conversions/month - Annual impact: $8.06M in unrealized revenue
Conclusion
Systematic buying signal detection separates high-performing sales organizations from those leaving revenue on the table.
Implementation priorities:
1. Deploy signal scoring — Differentiate response urgency based on the 1-10 framework
2. Establish response SLAs — High-intent signals require sub-5-minute response
3. Track multi-signal patterns — Organizations monitoring 5+ signal types achieve 78% conversion versus 12% for single-signal approaches
4. Recognize negative signals — Disqualify non-opportunities early to focus resources effectively
5. Account for decay — High-intent signals have 24-72 hour windows
Start with five core signals: pricing page visits, demo requests, case study downloads, multiple stakeholder engagement, and repeat website visits.
The organizations winning in B2B sales recognize purchase intent first and respond fastest.
Ready to detect buying signals across your website? ObserviX provides real-time visitor tracking, company identification, and automated signal detection—ensuring sales teams see every high-intent prospect before competitors do.