Introduction
Content marketers are under more pressure than ever to prove the real impact of their work. You need to understand which content drives results, what’s worth investing in, and how your efforts influence business outcomes.
Attribution analysis gives this clarity. It allows you to pinpoint which campaigns, content clusters, or touchpoints actually contribute to conversions and revenue—enabling smarter, data-driven decisions.
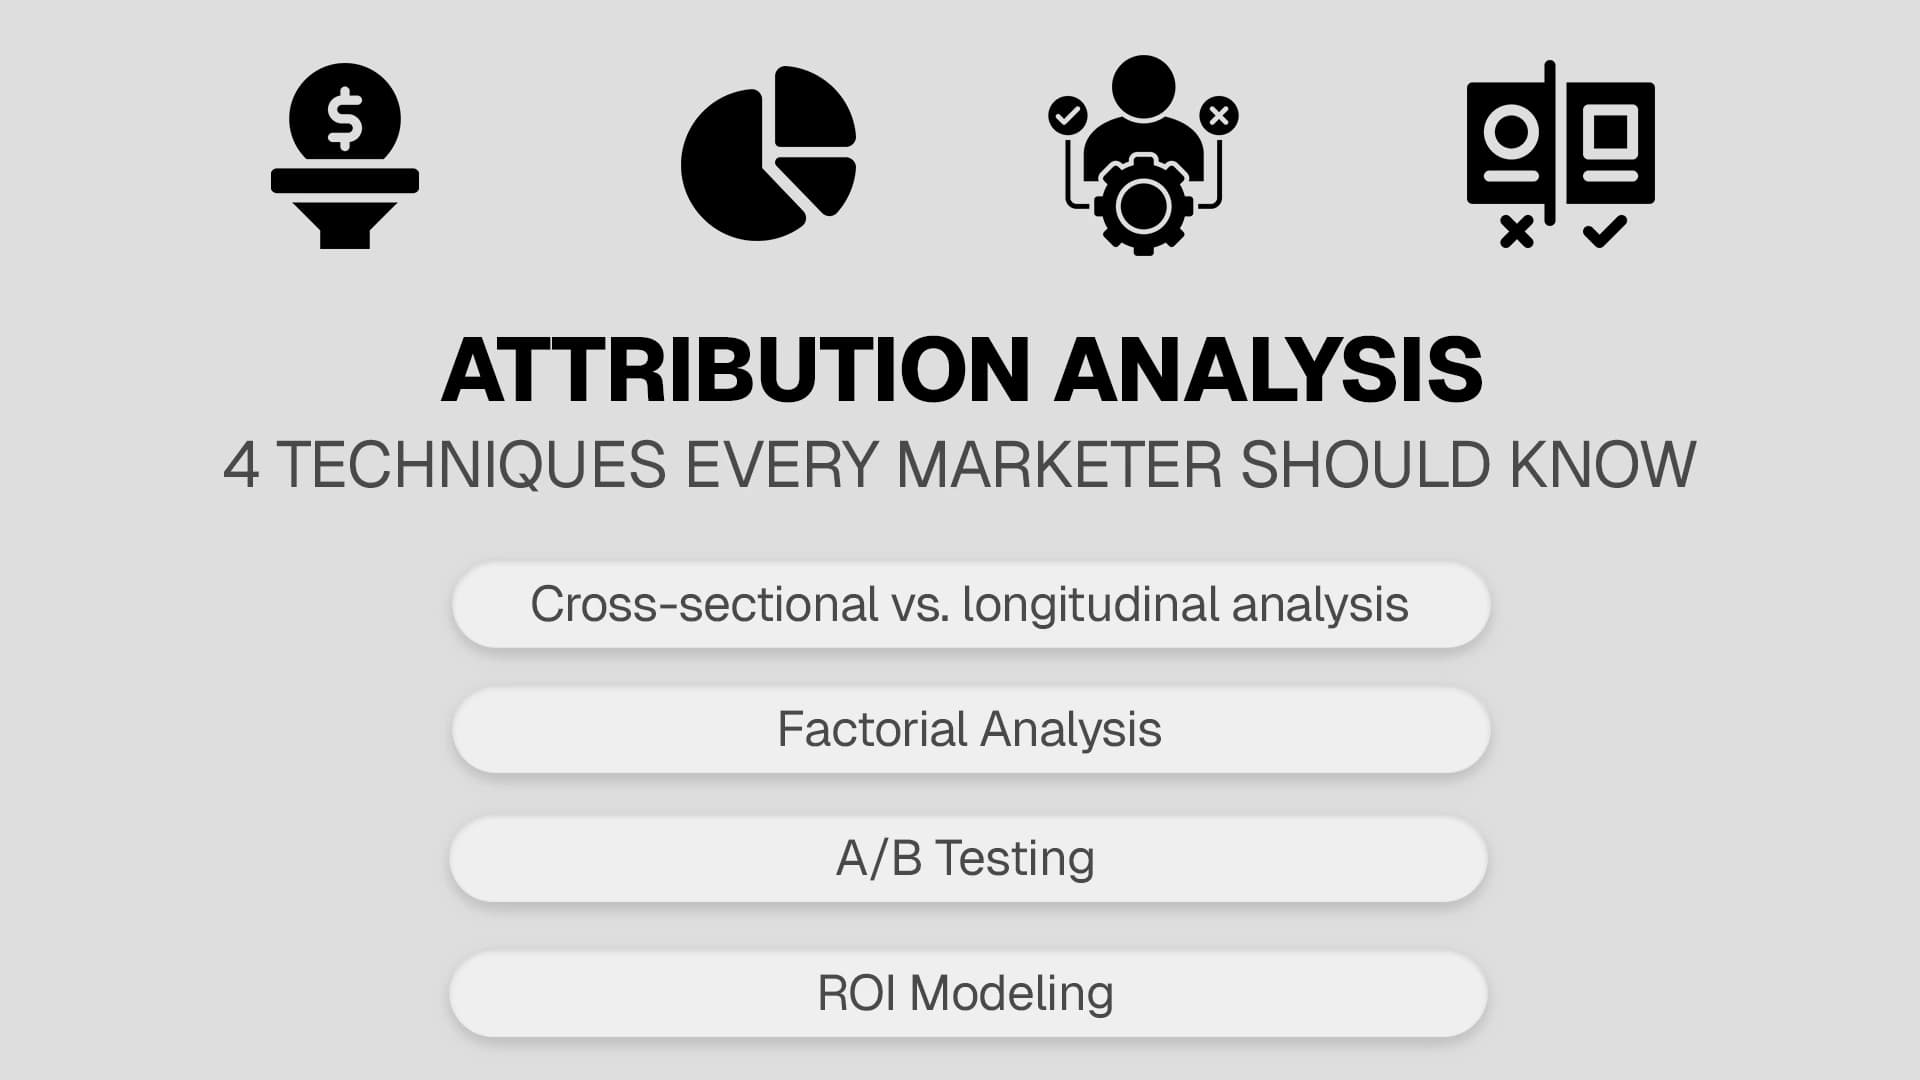
This guide covers four key attribution techniques every marketer should know: cross-sectional vs. longitudinal analysis, factorial analysis, A/B testing, and ROI modeling. Each method includes examples and actionable tips that can be applied using ObserviX, GA4, or Looker Studio dashboards.
1. Cross-sectional vs. longitudinal analysis

Cross-sectional analysis provides a snapshot of your content performance at a specific moment, highlighting what is working now. Longitudinal analysis, on the other hand, tracks changes over time, showing trends and helping you understand why performance shifts—whether due to audience behavior, market trends, or seasonal effects.
Example:
A B2B SaaS company using ObserviX monitors three content clusters: AI-Driven Automation, Workflow Optimization, and Compliance Best Practices. Cross-sectional analysis shows:
| Content Cluster | Page Views | Demo Sign-Ups | Sign-Ups per Page View |
|---|---|---|---|
| AI-Driven Automation | 14,210 | 58 | 40.8% |
| Workflow Optimization | 11,578 | 72 | 62.2% |
| Compliance Best Practices | 8,921 | 39 | 43.7% |
With ObserviX attribution, the team can see which clusters are high-converting and which are underperforming. You can also compare performance across different attribution models, as discussed in related posts on attribution approaches, to see how your conclusions might shift depending on the method used.
2. Factorial Analysis

Factorial analysis examines how multiple variables—like content type and distribution channel—interact to influence performance.
For example, ObserviX can show how different CTAs perform across clusters like Reporting, Customer Onboarding, and Employee Development. Using a 3x2 factorial setup (3 clusters × 2 CTAs), you might discover that Reporting content with CTA A drives higher conversions than Customer Onboarding, even though Customer Onboarding generally performs better.
These insights help adjust content assignments, optimize CTAs, and control for variables like author or page layout. When performing factorial analysis or A/B tests, it’s also useful to check insights on GA4 limitations to avoid misinterpreting the data.
3. A/B Testing

A/B testing is one of the most effective ways to understand what drives real results. It can be applied to landing pages, product pages, blog design, CTAs, meta titles, and more.
Example:
A company wants to see if introducing first-person language in blog introductions increases demo sign-ups. They test:
- 40 new articles with first-person intros
- 40 new articles without first-person intros
- 40 older articles refreshed with first-person intros
- 40 older articles as a control group
ObserviX tracks the full customer journey across these tests, showing not just page visits but actual conversions and revenue impact. Integrating attribution data with similar A/B experiments helps see not only which version performs better but also why, and informs scaling decisions naturally.
4. ROI Modeling
Calculating ROI is one of the toughest challenges in content marketing. ObserviX simplifies this by connecting content performance to real business metrics—like demo sign-ups, conversions, and revenue—rather than just clicks or impressions.
How it works:
- Assign weightings to each conversion type (e.g., demo sign-up = 0.005, free trial = 0.008).
- Use dashboards to calculate weighted conversions and normalize scores by visitor count.
- Multiply by Lifetime Customer Value (LCV) and subtract production costs to get true ROI per page.
This approach makes it easy to see which content drives the best ROI and informs strategic decisions about where to invest next.
Conclusion
Attribution analysis gives marketers clarity and confidence. Using cross-sectional snapshots, longitudinal trends, factorial analysis, A/B testing, and ROI modeling with tools like ObserviX, you can focus on high-impact content, optimize campaigns, and measure the real business value of every marketing effort.
By weaving attribution insights directly into your strategy, you improve performance and create a repeatable framework for ongoing growth.