
Only 30% of CMOs confidently measure marketing ROI. That means 70% are defending budgets with last-click attribution that's off by 40-60%.
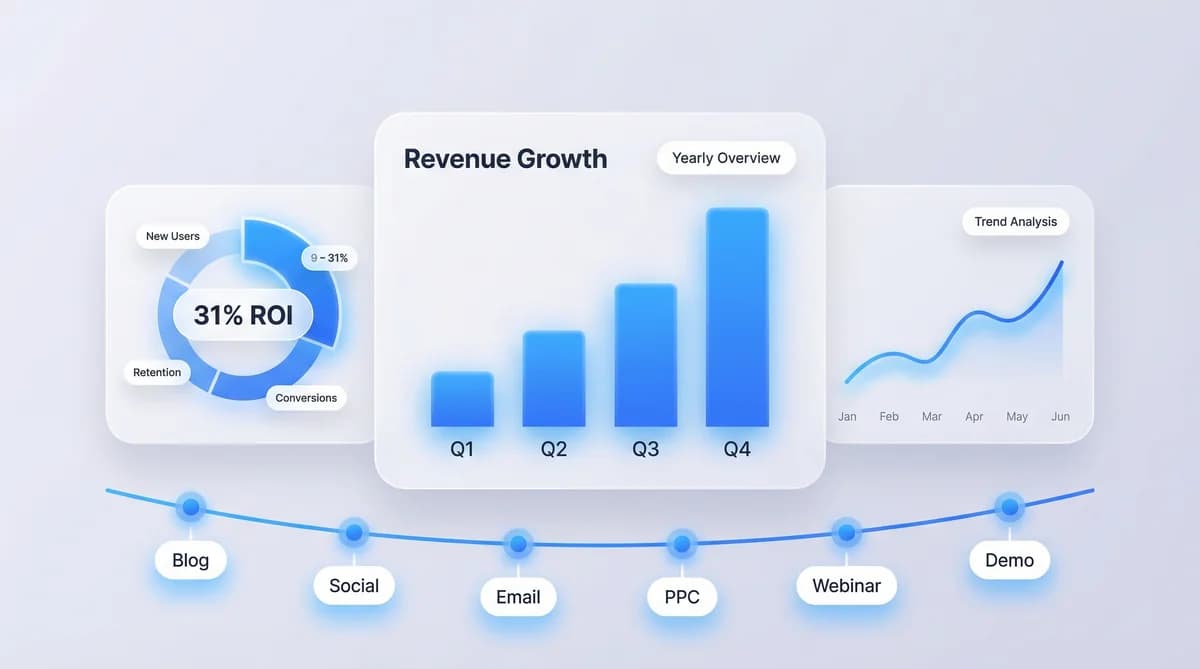
The reality? Companies implementing multi-touch attribution see 31% ROI improvement within 6 months. They identify an average of $112K in wasted spend. Scale winners 2.1x faster.
The core goal? Stop guessing. Start measuring.
What Is Marketing Attribution?
Marketing attribution identifies which touchpoints contribute to conversions and assigns them proportional credit.
Picture this: a customer converts after 12 touchpoints—blog post, Facebook ad, webinar, email, retargeting ad. Last-click gives 100% credit to that final retargeting ad. Multi-touch reveals the truth: your blog educated (31% credit), webinar built trust (22%), retargeting closed (18%).
Translation: The content you almost cut did the heavy lifting. Retargeting took the bow.
Why Marketing Attribution Matters Now
Privacy Killed Traditional Tracking
78% of attribution setups will fail by end of 2026. Google retired Privacy Sandbox in October 2025 after showing 60-100% inaccuracy. iOS blocks 27% of US mobile traffic. Third-party cookies? Functionally dead.
First-party data strategies aren't optional anymore.
Most CMOs Can't Prove ROI
Without attribution, you can't defend marketing budgets. 64% of CMOs now use attribution data to justify spending. The other 36%? They're losing budget battles.
Multi-Touch Reveals Hidden Value
Single-touch models undervalue mid-funnel by 40-60%. Content marketing gets 7% credit under last-click but actually influences 31% of revenue. That's the difference between cutting a team and expanding it.
When to Use Different Attribution Models
Not every model works for every business.
Choose last-click when:
- Sales cycle under 24 hours (e-commerce impulse buys)
- Single dominant channel (90%+ traffic)
- Budget under $5K/month (complexity isn't worth it)
Choose multi-touch when:
- Sales cycle 7-90 days
- Multiple marketing channels (paid, organic, email, content)
- Budget $5K+/month
- Expected ROI improvement: 22-31%
Choose data-driven (AI) when:
- Sales cycle 30+ days with 15+ touchpoints
- Budget $20K+/month
- 1,000+ monthly conversions (machine learning needs data)
- Expected ROI improvement: 25-35%
For detailed breakdowns of each model's credit distribution and use cases, see our complete guide to marketing attribution models.
How to Measure Attribution: 5 Steps

1. Audit Your Tracking
Before implementing attribution, verify what you're collecting:
- Google Analytics 4 properly configured? (See our GA4 setup guide to avoid the 81% error rate)
- UTM parameters on all campaign links?
- CRM capturing lead source data?
- Server-side tracking installed? (95-98% accuracy vs. 70-80% pixel-only)
Red flag: If 20%+ conversions show "direct / none," fix tracking first.
2. Choose Your Model
Match the model to your sales cycle:
| Sales Cycle | Model | Why |
|---|---|---|
| < 7 days | Last-click | Simple, sufficient for short cycles |
| 7-30 days | Linear multi-touch | Baseline multi-touch |
| 30-90 days | Time-decay | Weights recent touches more |
| 90+ days | Data-driven (AI) | Handles complex journeys |
B2B SaaS reality: Average 7.2-month cycle, 31.2 touchpoints, 8.4 stakeholders. Multi-touch is mandatory.
3. Implement UTM Tracking
Tag every marketing link consistently:
utm_source=linkedin
utm_medium=paid-social
utm_campaign=q2-2026-demand-gen
Rules:
- Always lowercase
- Use hyphens, never spaces
- Document your taxonomy
Impact: 42% reduction in tracking errors with standardized UTM naming.
4. Connect Your Data Sources
You need unified data across:
- Ad platforms (Google, Facebook, LinkedIn)
- Analytics (GA4, ObserviX for unified tracking)
- CRM (Salesforce, HubSpot)
- Offline conversions (call tracking, in-store visits)
Why it matters: 30-40% attribution accuracy lost when systems don't communicate.
5. Set Your Attribution Window
Match your attribution window to actual sales cycle length:
- B2C e-commerce: 7-30 days
- B2B SaaS: 60-90 days
- Enterprise B2B: 90-180 days
Using a 7-day window for a 90-day sales cycle misses 70-80% of the journey.
Best Practices
Start Simple, Scale Complex
Don't build AI attribution on day one.
Phase 1 (Month 1-3): UTM tracking, GA4, basic multi-touch Phase 2 (Month 4-6): CRM integration, refine model Phase 3 (Month 7-12): Server-side tracking, data-driven models
Validate with Incrementality Testing
Attribution shows correlation. Incrementality proves causation.
52% of marketers now run holdout tests to validate insights. They discover 23% wasted ad spend on channels claiming credit for organic conversions.
How: Pause a channel for 2-4 weeks, measure actual conversion drop vs. attribution-predicted drop.
Track Offline Conversions
40-70% of conversions happen offline in industries like home services, healthcare, and retail.
Without call tracking and CRM integration, you're blind to most of your revenue. 30-50% ROI improvement with proper offline integration.
Common Mistakes to Avoid
Mistake 1: Trusting Platform Self-Reporting
Facebook says 4.2x ROAS. Google says 3.8x. Both credit the same conversions.
The fix: Use independent attribution. One agency found 15% ROAS overstatement in Facebook's self-reporting.
Mistake 2: Inconsistent UTM Tagging
Team uses "LinkedIn," "linkedin," and "linkedin-ads." Google Analytics treats these as three separate sources.
The fix: Document UTM standards, mandate builder tools, always use lowercase.
Mistake 3: Attribution Window Mismatch
Using 30-day windows for 90-day sales cycles undervalues top-funnel by 60%+.
The fix: Set windows to capture 80-90% of conversions within the lookback period.
Mistake 4: Ignoring Data Quality
61.5% of attribution decisions fail due to poor data quality—missing UTMs, duplicate records, disconnected systems.
The fix: Audit monthly. If 20%+ conversions lack source attribution, fix tracking before making budget changes.
Attribution Models Comparison

| Model | Credit Distribution | Best For | ROI Improvement |
|---|---|---|---|
| Last-Click | 100% to final touch | Sales cycles < 24h | Baseline |
| Multi-Touch | Distributed across journey | Most B2B, longer cycles | +22-31% |
| Data-Driven (AI) | ML assigns based on data | 1,000+ conversions/month | +25-35% |
The fundamental difference? Single-touch asks "What happened first or last?" Multi-touch asks "What happened throughout the journey?" Data-driven asks "What statistically predicts conversion?"
Real-World Example
Company: Mid-market B2B SaaS ($8M ARR, $680K marketing budget)
Before multi-touch:
- Content marketing credit: 7%
- Paid ads credit: 72%
- Marketing ROI: 2.8x
After implementation (6 months):
- Content marketing credit: 31% (+343%)
- Paid ads credit: 41% (corrected)
- Marketing ROI: 4.1x (+46%)

Impact: Reallocated $112K from overvalued paid channels to content. Overall ROI improved 46% in 12 months, using strategies from our marketing ROI measurement framework.
Key lesson: Last-click credited paid ads because they closed deals. Multi-touch revealed blog posts and webinars did the actual selling months earlier—but got zero credit.
Key Takeaways
- Multi-touch reveals 40-60% hidden value in mid-funnel activities last-click ignores—typically content, email, and webinars
- Start with your sales cycle length—under 7 days gets last-click, 7-90 days needs multi-touch, 90+ days requires data-driven
- Data quality determines success—61.5% of attribution decisions fail due to poor implementation, not wrong models
- Validate correlation with causation—52% of marketers now use incrementality testing to identify 23% wasted spend
- First-party data is mandatory in 2026—cookie deprecation impacts 78% of setups; migrate to server-side tracking now
Ready to stop guessing and start measuring? ObserviX unifies attribution tracking across every channel—online and offline—in one dashboard.