Introduction
80% of the B2B buying journey happens before your sales team enters the conversation. By the time a prospect picks up the phone, they've already visited your site multiple times, read your competitors' content, checked peer reviews, and formed an opinion that's nearly impossible to change.
You weren't in the room for any of it.
That's the core problem customer journey analytics solves—not just knowing where traffic comes from, but understanding the full sequence of decisions, doubts, touchpoints, and micro-moments that turn a stranger into a customer, and a customer into someone who stays or leaves.
The stakes? Measurable. Poor customer experience puts $3.7 trillion in global annual sales at risk (Salesforce State of Marketing 2025). And yet 65% of marketing leaders have adopted journey analytics tools, but only 43% are actually using their full capabilities (Gartner 2025). That 22-point gap between adoption and utilization—tools sitting idle while buyers move through unmapped journeys—is the competitive window this guide is designed to close.
What Is Customer Journey Analytics?
Customer journey analytics is the practice of collecting, connecting, and analyzing behavioral data across every touchpoint a buyer encounters—from first awareness through purchase, retention, and expansion—to understand what drives conversion, loyalty, and revenue.
The core goal? Replace assumption-based decisions with evidence from actual buyer behavior.
Here's where most teams get this wrong: they confuse it with web analytics or CRM reporting. Those are valuable—but incomplete. Web analytics measures page-level activity. CRM reporting captures post-sale data. Customer journey analytics unifies both and adds every touchpoint in between to build a complete picture of how buyers actually move.
Standard web analytics tells you: "1,200 users visited the pricing page." Journey analytics tells you something more useful—"Of those 1,200 users, 68% came from a blog post published three weeks ago. 41% had already seen a product demo email. The 23% who converted had an average of seven prior touchpoints. The 77% who didn't had an average of two."
Context, sequence, behavioral pattern. That's what makes journey data actionable rather than decorative.
Four core capabilities define a mature customer journey analytics function:
- Path analysis — Maps the actual routes buyers take, not the routes you designed for them
- Funnel analysis — Identifies drop-off rates at each conversion stage with statistical precision
- Attribution analysis — Assigns revenue credit across every touchpoint in the journey
- Predictive intelligence — Uses behavioral signals to forecast churn, upgrade propensity, and next-best actions
The customer journey analytics market reached $25.1 billion in 2026, growing at 18-20% CAGR through 2030, with CDPs expanding at 39.9% CAGR (MarketsandMarkets 2026). That growth rate isn't accidental. Organizations are finally connecting the dots between buyer behavior and revenue outcomes.
Why Customer Journey Analytics Matters
Here's the number that stops most marketing leaders cold: 65% adoption, 43% utilization—a 22-point gap representing an enormous missed opportunity. The companies that close this gap first gain an analytical advantage while competitors are still reconciling spreadsheets.
Worth noting: this isn't a small edge. It's structural.
Revenue-weighted decisions. Journey analytics moves budget from where you assumed it worked to where it actually works. Organizations in the top quartile of journey analytics maturity achieve 5.7x marketing ROI versus 1.8x for bottom-quartile organizations (Qualtrics XM Institute 2024, N=210). The personalization that journey data enables delivers 5-8x ROI on investment and 5-15% revenue increases (McKinsey 2025, N=500). Those aren't marginal gains.
Friction identification at scale. Every journey has a point where prospects stall or fall off. ING Bank identified specific friction in their account onboarding flow through journey mapping—and reduced onboarding time by 70% while lifting conversion 25%. An Post Insurance found a single confusing form field. The fix produced a 6% conversion improvement. Systematically removing journey friction compounds into significant revenue recovery—and in both cases, it wasn't new technology that delivered the result. It was better interpretation of existing behavioral data.
The B2B invisibility problem. In B2B, 80% of the buyer journey now happens without any salesperson involvement (Gartner 2025). By the time a prospect contacts your sales team, they've typically consumed 3-7 pieces of content from the eventual winning vendor (Demand Gen Report 2025) and formed strong preferences. Without journey analytics, you're optimizing blind for the majority of your pipeline.
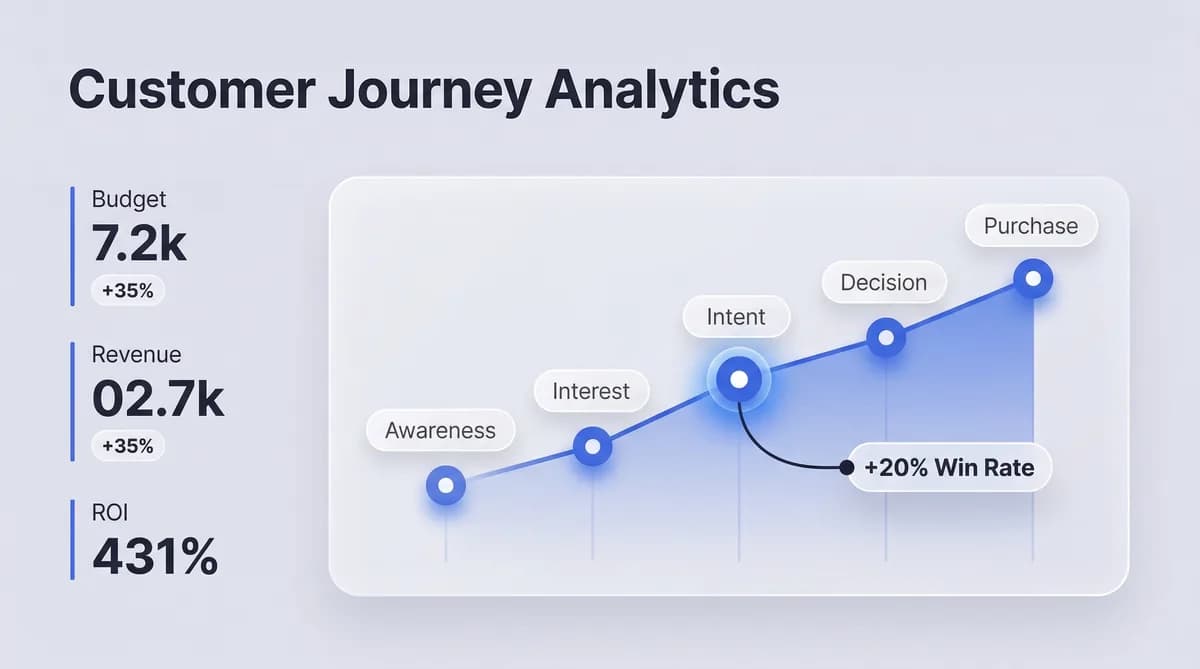
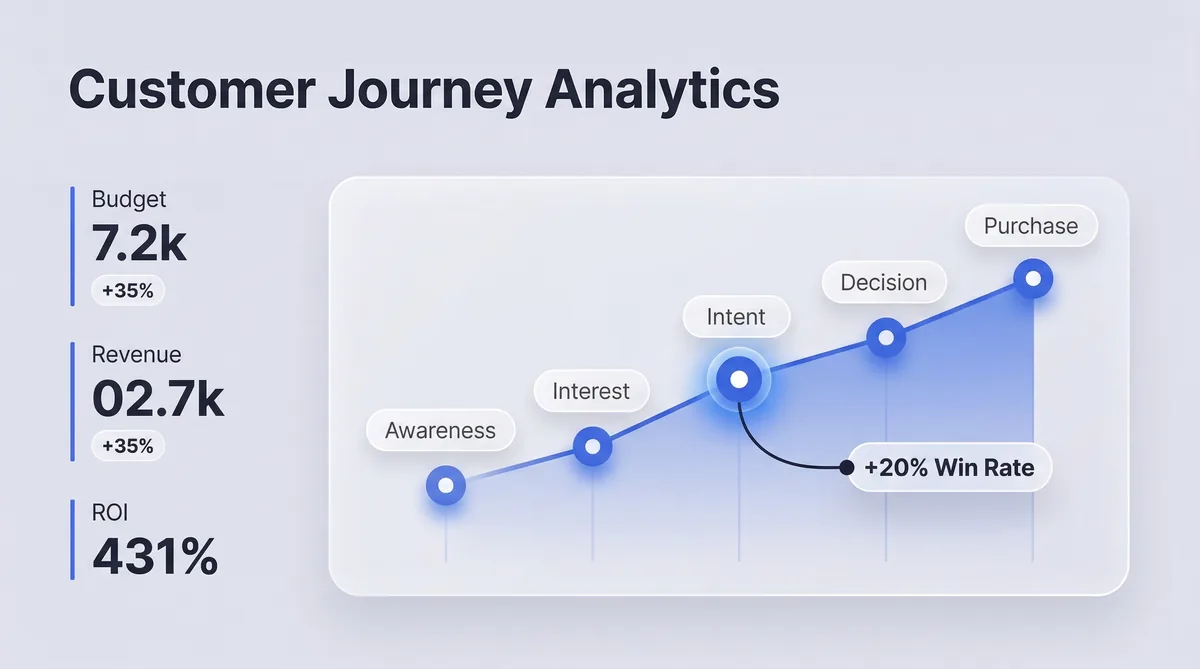
The ROI case. Journey orchestration—the advanced application of journey analytics—delivers a 431% three-year ROI in companies that implement it fully (Forrester 2025, N=210 enterprise organizations). The conservative scenario still produces returns above 87% in year one. Numbers like these don't emerge from rounding errors.
Journey Stages With Stage-Specific KPIs
Most journey frameworks describe stages as concepts. This one connects each stage to the metrics that tell you whether it's working—and the benchmarks that tell you whether you should be worried.
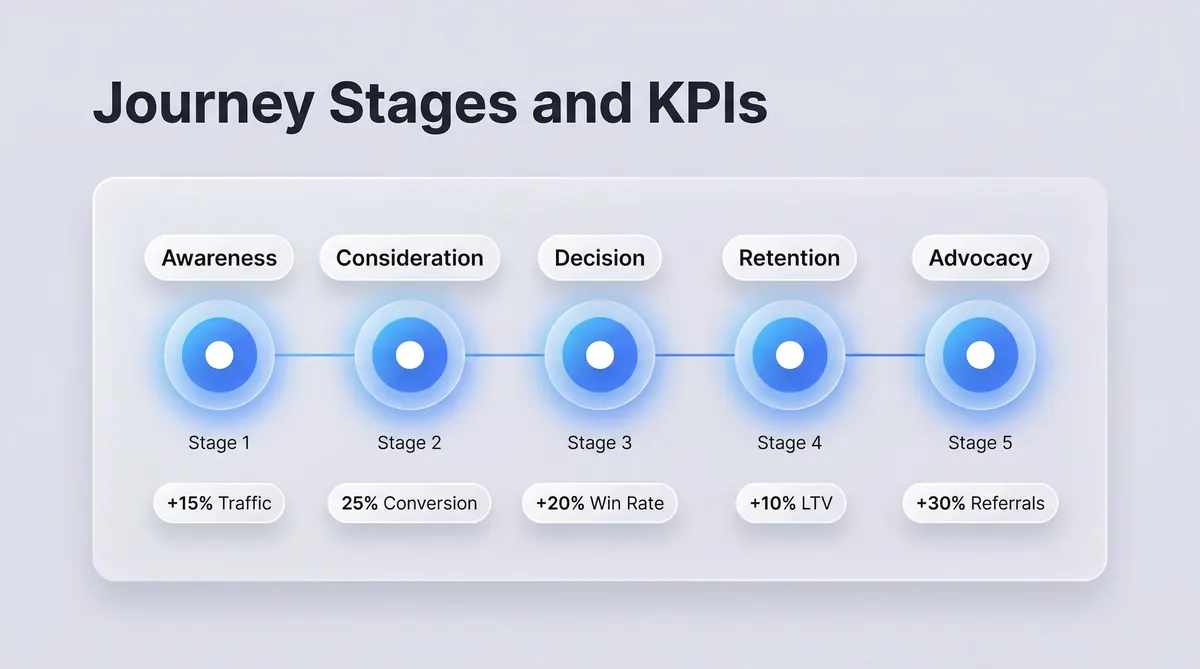
Stage 1: Awareness
The buyer recognizes a problem. They may not know your brand yet.
Key touchpoints: Organic search, LinkedIn content, paid display, word-of-mouth, industry publications
| KPI | Benchmark | Warning Signal |
|---|---|---|
| Branded search volume growth | +15-20% MoM | Flat for 60+ days |
| Content engagement depth | 40-60% article completion | Under 25% |
| Time to second touchpoint | Under 14 days | Over 21 days |
If your awareness-stage content isn't driving return visits within two weeks, it's generating impressions—not intent. That distinction matters more than most teams realize.
Stage 2: Consideration
The buyer is actively evaluating solutions. This is where 70% of customer journeys involve 10 or more distinct touchpoints (Salesforce 2025), and where most of the invisible B2B journey unfolds.
Key touchpoints: Review sites, comparison pages, case studies, webinars, email nurture, peer communities
| KPI | Benchmark | Warning Signal |
|---|---|---|
| Return visitor rate | 25-35% | Under 15% |
| Demo/trial request rate | 2-5% of qualified traffic | Under 1% |
| Email nurture open rate | 28-35% for segmented sequences | Under 18% |
Consideration-stage channels—content, webinars, email—appear to generate zero conversions under last-click attribution. Journey analytics reveals they often influence 30-47% of eventual conversions. That insight protects budgets from being cut based on incomplete data. And budgets get cut on incomplete data all the time.
Stage 3: Decision
The buyer is choosing between a shortlist. In B2B, this stage often involves 5-10 decision-makers per enterprise purchase, each on their own sub-journey.
Key touchpoints: Pricing pages, ROI calculators, security documentation, demos, reference calls, contract negotiation
| KPI | Benchmark | Warning Signal |
|---|---|---|
| Demo-to-trial conversion rate | 20-35% | Under 12% |
| Trial activation rate | 40-60% within 7 days | Under 25% |
| Stakeholder engagement breadth | 3+ contacts per account | Only 1 contact engaged |
When new senior contacts from a target account begin engaging with content, that's the signal to escalate executive outreach—before a competitor does.
Stage 4: Retention
The purchase was made. Most marketing teams check out at this point. That's a mistake—and an expensive one. Retention is where the majority of lifetime value is built or destroyed, especially in SaaS.
Key touchpoints: Onboarding emails, in-product tutorials, customer success interactions, renewal conversations
| KPI | Benchmark | Warning Signal |
|---|---|---|
| Time-to-first-value | Under 7 days (SaaS); under 30 days (enterprise) | Over 14 days |
| 30/60/90-day feature adoption | 40-60% of core features | Under 25% by day 30 |
| Churn propensity score | Track by behavioral signal | Spikes >20% month-over-month |
CloudMetrics identified that customers who hit a specific feature milestone in week two had 3x the retention rate—driving a 40% CAC reduction and 65% MRR increase within six months. The behavioral signal existed in their data the whole time. They just weren't looking at it.
Stage 5: Advocacy
A small but disproportionately valuable segment becomes a source of referrals, reviews, and social proof. Journey analytics reveals what distinguishes advocates from passive customers—and that sequence is repeatable.
| KPI | Benchmark | Warning Signal |
|---|---|---|
| Net Revenue Retention (NRR) | 110-130% (SaaS world-class) | Under 95% |
| Referral conversion rate | 2-4x higher than cold traffic | Lower than cold traffic |
| Expansion ARR % | 20-40% of total ARR | Under 10% |
Companies with strong advocacy programs see 25-40% of new revenue come from referrals. If yours is significantly lower, your advocacy stage has friction you haven't identified yet.
Touchpoint Analysis and Journey Mapping
A touchpoint is any moment a buyer interacts with your brand. 70% of buyer journeys involve 10 or more touchpoints. In complex B2B sales, the average before close is 60 touchpoints—spanning content, peer conversations, sales interactions, and product trials (Salesforce 2025). Most companies track 20-30% of these intentionally. The rest happen in the dark.
This is where most teams get stuck: they know they're missing data, but they don't know where to start.
The four steps to meaningful touchpoint mapping:
Step 1: Build your channel inventory. List every channel where buyers can interact with you—paid, organic, email, social, direct, events, sales calls, product trials, referrals. Don't assume you know this already. The inventory usually surfaces channels teams forgot they were running.
Step 2: Instrument every channel. UTM parameters on paid and social, first-party analytics on your website, CRM integration for sales, product event tracking in your application. A clean UTM taxonomy is the highest-leverage, lowest-cost action in journey analytics—one B2B team discovered 40% of their "direct" traffic was actually paid campaigns with broken UTM tracking. Forty percent. Gone from every attribution report.
Step 3: Resolve identity across channels. The same person might visit your site anonymously, sign up for a trial, and convert after a sales call. Stitching those interactions into a single customer record requires identity resolution—matching anonymous behavior to known contacts. This is technically the hardest step. It's also the one that makes everything else worthwhile.
Step 4: Map paths to outcomes. Trace which sequences of touchpoints lead to conversion, expansion, or churn.
Translation: You're building a map of the roads your buyers actually travel—not the roads you assumed they'd take.
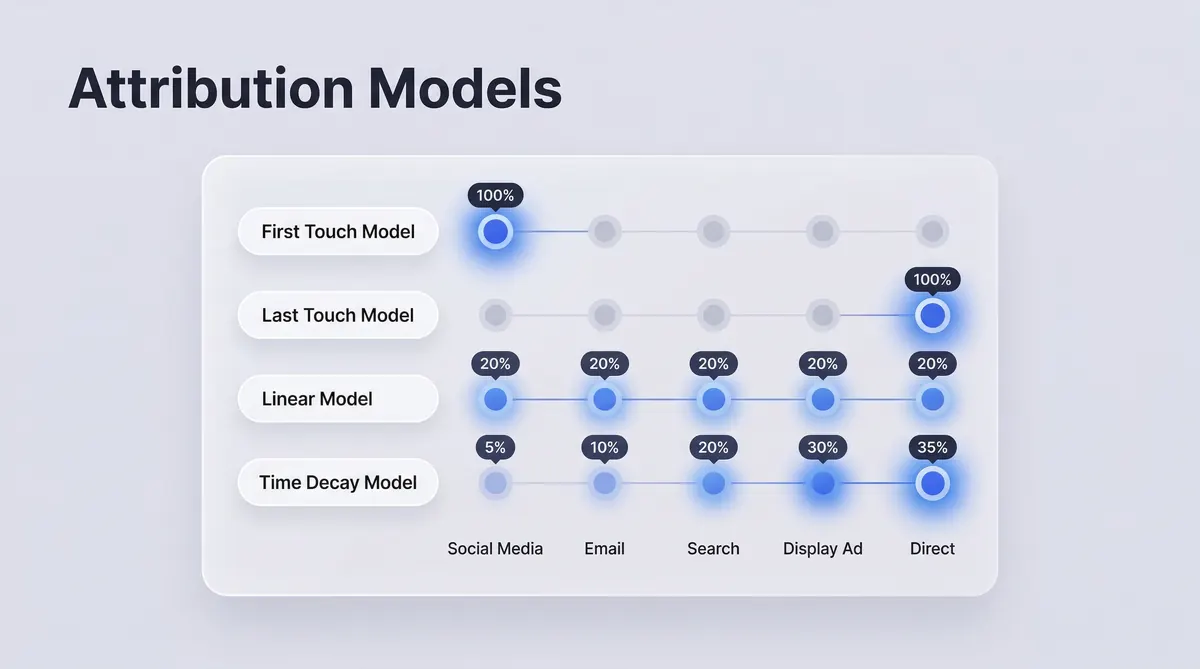
Attribution Models and Revenue Impact
Attribution models determine how credit for a conversion gets distributed across the touchpoints in a buyer's journey—and the model you choose leads to radically different budget decisions. For a detailed breakdown of each model's mechanics, see our guide to marketing attribution models. The same sequence tells completely different stories depending on which model you apply.
The scenario: A $150,000 B2B deal closes after: Blog post (Day 1) → LinkedIn ad (Day 12) → Webinar (Day 31) → Email nurture (Days 35-60) → Demo request (Day 63) → Sales calls (Days 65-90).
| Attribution Model | Blog Post | LinkedIn Ad | Webinar | Demo | Budget Implication | |
|---|---|---|---|---|---|---|
| First-Touch | $150,000 | $0 | $0 | $0 | $0 | Over-invest in organic; undervalue everything else |
| Last-Touch | $0 | $0 | $0 | $0 | $150,000 | Cut content; fund bottom-funnel only |
| Linear (equal) | $30,000 | $30,000 | $30,000 | $30,000 | $30,000 | Balanced but ignores actual influence |
| Time-Decay | $5,000 | $12,000 | $22,000 | $35,000 | $76,000 | Favors recency over true contribution |
| Multi-Touch (W-shaped) | $52,500 | $15,000 | $30,000 | $15,000 | $37,500 | Rewards first touch and conversion |
| Data-Driven (ML) | $41,000 | $18,000 | $27,500 | $21,000 | $42,500 | Reflects actual conversion probability |
Under last-touch, the blog post receives $0 and the demo receives $150,000. The rational budget response: cut content, fund more demos. Under W-shaped multi-touch, the blog post receives $52,500—35% of deal value—because it initiated the journey that made everything else possible.
Different model. Same deal. Completely different strategic conclusion.
| Attribution Model | Budget Decision | 12-Month Impact ($1M Budget) |
|---|---|---|
| Last-Touch only | Over-fund demos; gut content | -$220K misallocated |
| First-Touch only | Over-fund top-of-funnel; cut conversion | -$180K misallocated |
| Multi-Touch | Balance across influence points | Baseline optimal |
| Data-Driven (ML) | Continuous algorithmic reallocation | +$143K incremental ROI |
Source: Gartner 2025 Marketing Attribution Benchmark, N=420 companies, p<0.01
Organizations transitioning from last-touch to multi-touch attribution identify a median $112,000 in misallocated budget in their first 90 days of analysis. The numbers don't lie.
Which model should you use? Last-touch works only for sub-24-hour consideration cycles. Time-decay suits 7-30 day cycles. W-shaped works when you have a clear awareness entry and conversion moment. Data-driven is the gold standard—but requires 400+ conversions to train reliably. Start with what your data volume can support, not what sounds most sophisticated.
B2B vs. B2C Journey Architecture
Customer journey frameworks built for B2C don't work in B2B. The architecture is fundamentally different—not just in degree but in kind.
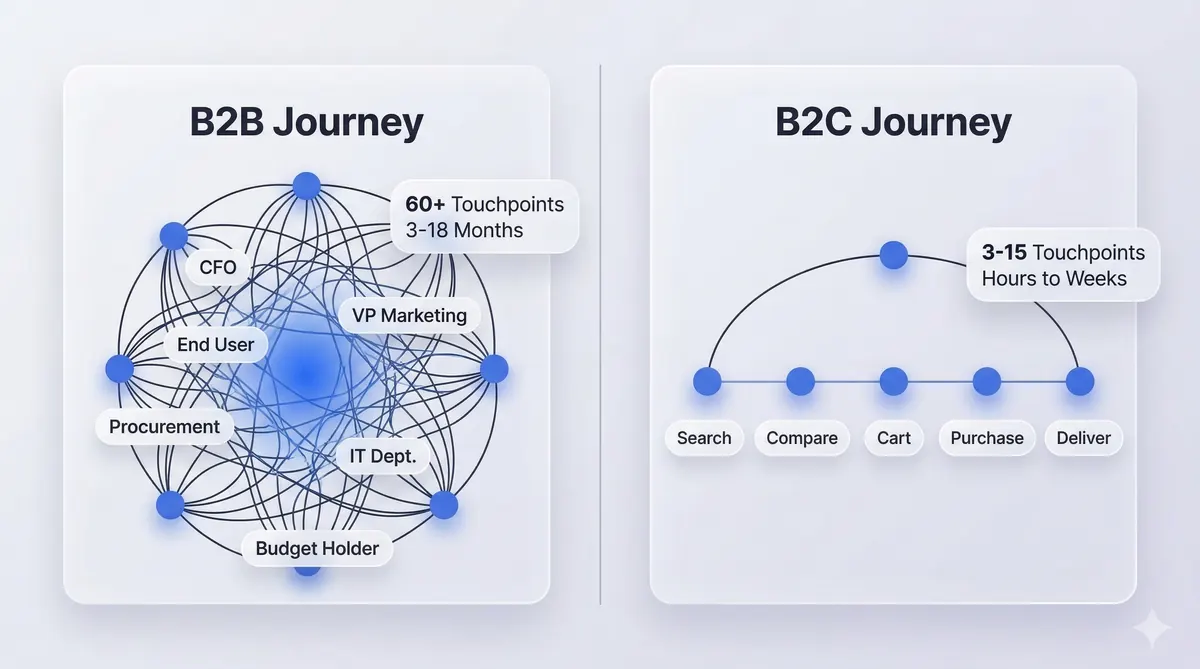
| Dimension | B2B Journey | B2C Journey |
|---|---|---|
| Decision-makers | 5-10 stakeholders (committee) | 1-2 (individual or household) |
| Cycle length | 3-18 months | Hours to weeks |
| Touchpoints before close | 30-60+ | 3-15 |
| Invisible journey % | 80% pre-sales | 20-40% |
| Personalization unit | Account-level | Individual-level |
| Attribution priority | Multi-touch / data-driven | Time-decay + last-touch |
| Primary success metric | Pipeline velocity / win rate | ROAS / LTV |
The B2B Multi-Stakeholder Framework
B2B journey analytics must operate at the account level, not the individual level. A deal doesn't close because one person decided—it closes because a buying committee reached consensus.
| Stakeholder | Avg Touchpoints | Decision Influence | Key Journey Signal |
|---|---|---|---|
| End User (Champion) | 18-22 | 15% | Feature adoption rate, trial usage |
| Manager/Director | 10-14 | 25% | Demo request rate, team engagement |
| VP/Head of | 7-10 | 30% | Proposal acceptance, exec engagement |
| CFO/Finance | 3-5 | 20% | Contract approval speed |
| CTO/IT | 5-8 | 10% | Technical sign-off, compliance |
The CFO engages with only 3-5 touchpoints but influences 20% of the deal. Journey analytics identifies which content reaches CFO-level stakeholders—and what sequence drives approval velocity. When three contacts from the same account engage with different content types in the same two-week period, that's a buying committee activating. That signal is invisible in individual-level analytics. You're watching one tree while missing the forest.
PLG journey signals. For product-led growth companies, product usage becomes the highest-signal touchpoint. Define Product-Qualified Leads (PQLs) based on behavioral patterns correlated with paid conversion: used core feature 3+ times in first 7 days, invited 2+ team members, hit the free plan ceiling. Companies that define PQLs this way consistently hit the top quartile trial-to-paid benchmark: 35-45% (vs. 8-15% bottom quartile). That gap—35-45% versus 8-15%—is what structured PQL definition is worth.
B2C scale. 7-Eleven Australia now delivers 250 million personalized moments annually across 1.2 million loyalty app users—representing 15% of total sales. Sephora's 25 million Beauty Insider members generate continuous journey data across web, app, and in-store—producing 22% cross-sell lift and 3x digital advertising ROI once unified. B2C scale changes the calculus, but the underlying principle remains: understand the actual journey, then optimize it. The attribution mechanics behind these B2C results follow a distinct set of rules, covered in our B2C marketing attribution guide.
Privacy-First Analytics Strategies
Third-party cookies are functionally obsolete across most of the web. Safari and Firefox blocked them years ago. Chrome's Privacy Sandbox rewrote the tracking architecture. iOS App Tracking Transparency reshaped mobile attribution. If your journey analytics still relies heavily on third-party cookies—you're building on a foundation that's actively crumbling.
Here's the thing: this isn't a crisis. It's an opportunity.
The companies that move to first-party and zero-party data now will have a durable competitive advantage. The companies that keep patching third-party approaches will fall further behind with each platform update.
The privacy-first attribution stack:
| Tier | Data Type | Accuracy | Primary Use | Cost |
|---|---|---|---|---|
| 1: Zero-Party | Declared preferences, surveys, quizzes | 94-98% | Personalization, segment definition | $10K-$30K integration |
| 2: First-Party Behavioral | Website, app, email, CRM behavior | 85-92% | Funnel analysis, attribution | CDP $30K-$80K/year |
| 3: Modeled Attribution | Statistical inference for gaps | 70-82% | Cross-channel budget allocation | Varies by platform |
| 4: Clean Room | Privacy-safe publisher/partner matching | Varies | Incrementality testing, reach | $50K-$200K+ |
| Channel | Cookie-Based | First-Party | Signal Recovery |
|---|---|---|---|
| Paid search | 95% coverage | 91% coverage | -4% (minimal loss) |
| Paid social (iOS) | 38% coverage | 76% coverage | +38% recovered |
| Organic search | 78% coverage | 83% coverage | +5% improved |
| 72% coverage | 89% coverage | +17% recovered |
Source: Privacy Attribution Impact Study 2025, N=320 advertisers
For paid social on iOS—where cookie-based tracking collapsed to 38% coverage—first-party methods recover 76%. That's not a small improvement. That's the difference between attribution that works and attribution that's actively misleading you.
First-party data strategies recover 60-80% of signal lost to cookie deprecation, at higher accuracy than cookie-based methods for owned-channel data. Server-side tracking is non-optional: it moves data collection from the browser (where 30-40% of B2B professionals use ad blockers) to your server, improving data capture by 15-40%. Declared preferences outperform inferred preferences in personalization by 2-3x.
Privacy-first companies aren't collecting less data. They're collecting better data.
ROI Calculation Methodology
Executives need business cases, not analytics philosophy. Here's a framework that survives a CFO review.
The ROI equation has four inputs:
-
Attribution improvement — Switching from last-touch to multi-touch reveals budget misallocation. Research benchmark: 18-28% of marketing spend goes to under-performing channels under last-click (Gartner 2025, N=420). On a $1M budget, that's $180K-$280K immediately redirectable. That's not theoretical savings—it's budget that exists today in the wrong channels.
-
Conversion improvement from friction removal — Systematically identifying and removing journey friction produces compounding conversion lifts. ING Bank: 25% lift. An Post Insurance: 6% from one form fix. Crazy Egg: 94% cumulative improvement across two A/B test iterations. Each fix compounds the previous one.
-
Retention value from early warning detection — Journey analytics that surfaces churn signals 60-90 days in advance enables proactive intervention. At a median customer LTV of $12,000, retaining 10 additional customers per month generates $1.44M annually. That math works on smaller numbers too.
-
Campaign efficiency gains — U.S. Bank reduced campaign deployment time by 80% (weeks → hours). When you can deploy, test, and learn that fast, the compounding effect on marketing efficiency is substantial—and difficult to overstate.
| Scenario | Annual Investment | Year 1 Return | Year 3 Return | Payback Period |
|---|---|---|---|---|
| Conservative | $180K | $157K (87% ROI) | $648K | 14 months |
| Moderate | $240K | $374K (156% ROI) | $1.2M | 9 months |
| Optimistic | $350K | $700K (200% ROI) | $1.86M (431% 3yr) | 6 months |
Research-backed: Moderate scenario aligns with Forrester 3-year ROI study, N=210 enterprise companies, 2025.
When to invest:
| Factor | Minimum Threshold | Strong Candidate |
|---|---|---|
| Annual marketing budget | $500K+ | $2M+ |
| Active channels | 3+ | 5-8 |
| Sales cycle length | 30+ days | 90-day average |
| Payback tolerance | Under 18 months | Under 12 months |
When to wait: Organizations with fewer than three active marketing channels, budgets under $500K, or transaction cycles under 48 hours will see limited incremental value beyond standard web analytics. Build data infrastructure first. A sophisticated attribution model on top of broken tracking produces sophisticated wrong answers.
Implementation Roadmap
The most common implementation failure: trying to boil the ocean. Companies deploy a CDP, connect 12 data sources, configure 30 journey triggers, and wonder why nothing is working six months later. The pattern repeats constantly—and it's avoidable. The proven approach is narrower and faster.
Phase 1: Foundation (Weeks 1-6) — Budget: $15K-$40K
Audit existing tracking (broken UTMs, untracked conversion events). Define journey stages and success metrics with sales, product, and customer success. Implement unified analytics across primary channels—website, paid, email, CRM at minimum. Establish server-side tracking for key conversion events and baseline KPIs for each stage.
What you'll have: Clean data foundation, consistent cross-channel tracking, a baseline to measure against. Not glamorous. Essential.
Phase 2: Attribution and Path Analysis (Weeks 7-20) — Budget: $20K-$60K
Connect CRM to your analytics platform. Deploy multi-touch attribution—start with linear or time-decay if data-driven requires more volume; any multi-touch model immediately improves decisions over last-click. Back-test against 6-12 months of historical data; the delta between last-touch and multi-touch is your most compelling ROI argument. Build journey maps for your three most common buyer paths from actual data. Identify your top three friction points.
What you'll have: A working attribution model, real journey maps, your first optimization wins.
Phase 3: Personalization and Prediction (Weeks 21-40) — Budget: $25K-$80K
Implement stage-based personalization—different content, offers, and CTAs based on journey position. Build churn prediction models using first-party behavioral signals. Deploy account-based journey scoring for B2B. Launch ABM campaigns with journey-based targeting.
What you'll have: A fully instrumented journey analytics system with personalization, prediction, and clear revenue attribution.
| Company Size | Phase 1 | Phase 2 | Phase 3 | Total Year 1 |
|---|---|---|---|---|
| Startup (<$5M ARR) | $10K-$20K | $15K-$30K | $15K-$30K | $40K-$80K |
| Mid-Market ($5-50M ARR) | $20K-$40K | $25K-$50K | $30K-$60K | $75K-$150K |
| Enterprise ($50M+ ARR) | $40K-$100K | $50K-$120K | $60K-$180K | $150K-$400K |
61% of journey analytics implementations fail to achieve target ROI because they start with technology selection rather than journey mapping (Gartner 2025). The correct sequence: define what decisions the analytics must inform → map current-state journeys → identify the highest-value gaps → select technology → implement incrementally.
Technology is the last decision. Not the first.
Best Practices
Start with a business question, not a data question. The best programs don't start with "what should we track?" They start with "what decision do we need to make, and what data would make that decision obvious?" Then they build backward. "Why do 40% of prospects who request a demo not show up?" is a better starting point than "let's collect everything." Collecting everything without a question produces a very expensive pile of data.
Assign clear ownership. Journey analytics data that belongs to everyone belongs to no one. Programs with a dedicated owner achieve 2.8x higher utilization rates than programs managed by committee (Gartner 2025). Ownership means accountability for turning insights into decisions—not just maintaining dashboards. Someone has to be responsible for what happens after the report runs.
Build leading indicators, not just lagging ones. Revenue and conversions tell you what happened. Define the behavioral signals that predict conversion at each stage—return visit rate, content depth, stakeholder engagement breadth—and track them weekly. The goal is finding out about journey problems before revenue has already been lost. Not after.
Close the loop between insights and actions. Every journey analysis should end with a prioritized list of experiments. Every experiment should have a success metric. Every result should feed back into the next analysis. Without this loop, analytics becomes reporting theater—expensive, time-consuming, and ultimately meaningless.
Make journey data accessible to the front lines. If your sales team can't see which content a prospect engaged with before requesting a demo, your journey data isn't helping close deals. The insights need to flow to sales, customer success, and product—not stay locked in marketing dashboards. Data that doesn't reach decision points doesn't change outcomes.
Common Mistakes to Avoid
Mistake 1: Running last-touch attribution on long sales cycles. For journeys exceeding 30 days, last-touch attribution misattributes 58-74% of revenue influence (Gartner 2025, N=420). It makes bottom-of-funnel channels look like heroes and defunds the channels that create awareness and consideration.
The fix: Implement at minimum a time-decay attribution model for any journey over 30 days. Our marketing attribution measurement guide covers the step-by-step process for transitioning from last-touch to multi-touch—including how to back-test against historical data to build your ROI case.
Mistake 2: Tracking contacts instead of accounts in B2B. When the VP joins a deal that's four months in, they appear as a "new lead" under contact-level analytics. Under account-level analytics, you see the committee activating. These are completely different strategic situations requiring different responses.
The fix: Implement account-level journey analytics with role-level engagement tracking. Score accounts on breadth and depth of engagement, not just individual contact activity.
Mistake 3: Mapping the journey you want buyers to take. Teams sit in a room and map the "ideal" customer journey, then call it journey analytics. 74% of planned customer journeys differ materially from actual buyer paths (McKinsey 2025). If your data and your assumptions disagree, the data is right.
The fix: Always anchor journey maps in behavioral data. Begin with your actual conversion paths—where did your last 20 closed deals start? That question takes 30 minutes to answer and usually produces more useful insight than any whiteboard session.
Mistake 4: Ignoring the post-purchase journey. Most analytics investments focus on acquisition. Retention and expansion are where most lifetime value is built—especially in SaaS. A customer who churns after one year may have been unprofitable. A customer who stays three years and expands is your most valuable asset. These two outcomes start diverging in week two of onboarding. Most teams don't look there.
The fix: Build a separate analytics framework for post-purchase journeys, tracking onboarding completion, feature adoption, health scores, and expansion signals with the same rigor you apply to acquisition.
Mistake 5: Waiting for perfect data before acting. Organizations that postpone analytics until "the data is complete" never begin. 70% data coverage in the first 90 days produces actionable insights. 100% coverage achieved 18 months later produces the same insights—minus 18 months of compounding return.
The fix: Launch with the data you have. Start with your CRM and web analytics combination. Iterate from there. Done is better than perfect when "perfect" takes a year and a half.
Real Case Studies: What Journey Analytics Actually Delivers
U.S. Bank: 300% Account Growth Through Journey Orchestration
U.S. Bank deployed a unified journey analytics platform connecting all digital touchpoints with real-time customer profiles—eliminating campaign cycles that previously took 4-6 weeks to execute.
Results: 300% account growth in targeted segments, 184x improvement in deposit conversion rates, 80% reduction in campaign deployment time (weeks → hours).
Key lesson: The 184x deposit conversion figure reflects journey-triggered offers—real-time prompts served at high-intent moments in a customer's digital session. The same offer, delivered at the right journey moment, converted at 184x the rate of untimed mass campaigns. Timing is everything. Journey analytics makes the timing visible.
Sephora: Loyalty Data as a Personalization Engine
Sephora unified behavioral data from 25 million Beauty Insider loyalty members across web, app, and in-store into real-time recommendation models identifying replenishment timing and cross-category purchase propensity.
Results: 22% cross-sell lift, 13-51% upsell lift by product category, 3x digital advertising ROI from journey-based audience targeting.
Key lesson: Journey analytics ROI compounds. Year one was infrastructure and model training. The lift numbers appear in year two as models mature. Patience with the foundation produces compounding returns—not linear ones.
ING Bank: 70% Faster Onboarding From One Journey Map
Journey analytics mapped the exact friction points in ING's mobile onboarding flow. It found that 43% of onboarding abandonment occurred at a single identity verification step taking 45+ minutes. They redesigned that specific step—not the entire flow.
Results: 70% reduction in onboarding time (hours → minutes), 25% conversion lift at the key verification stage.
Key lesson: The fix didn't require new technology. It required better interpretation of existing behavioral data. One friction point, targeted surgically, produced a 25% conversion improvement. Most teams would have redesigned the entire flow and delivered half the result at five times the cost.
CloudMetrics: 40% CAC Reduction via Retention Focus
This B2B SaaS company implemented multi-touch attribution revealing that content and webinars generated 47% of qualified pipeline—invisible under last-touch. Simultaneously, journey analytics on existing customers showed that customers who hit a specific feature milestone in week two had 3x the retention rate.
Results: 40% CAC reduction, 65% MRR increase from retention and expansion, 6-month payback on the analytics investment.
Budget reallocation: Before: 12% content/webinars, 34% SDR. After: 31% content/webinars, 18% SDR—driven entirely by attribution data showing where pipeline actually came from. The data didn't just change the dashboard. It changed the budget.
Monzo: First-Party Journey Analytics in Practice
UK digital bank Monzo built journey analytics entirely on first-party behavioral data within its app ecosystem. In-app behavioral signals revealed that customers engaging with savings goal features within 30 days of onboarding had 3x higher 12-month retention. They redesigned onboarding to surface savings goal creation as a core step.
Results: 30% increase in savings account adoption, 20% improvement in overall engagement within six months.
Key lesson: Zero-party and first-party data produce more accurate, more durable journey insights than anything built on third-party tracking. Monzo asked customers directly what they were trying to accomplish—and used declared intent signals to personalize onboarding. The privacy-first approach didn't limit what they could learn. It improved it.
Key Takeaways
-
The 22% utilization gap is your competitive window. 65% of marketing leaders have journey analytics tools. Only 43% use them effectively. Closing that gap before competitors do is the single highest-leverage analytics investment available in 2026.
-
Attribution model choice is a budget decision. The model you use determines where your marketing dollars go next quarter. Last-touch attribution systematically under-credits awareness and mid-funnel touchpoints—misallocating a median of $112K per $1M in marketing spend.
-
B2B journeys are committee journeys. Mapping a single buyer persona misses 60-80% of the decision process in enterprise deals. Build for the buying committee—with content, timing, and triggers for each stakeholder role. Account-level tracking is non-negotiable.
-
Privacy-first is not optional—and it's an advantage. Server-side tracking, CDPs, and first-party data architecture are the current operating requirement. First-party strategies recover 60-80% of signal lost to cookie deprecation, at higher accuracy for owned-channel data.
-
Implement narrowly before you scale broadly. Every successful deployment started with 3-5 journeys, not 30. The fastest ROI comes from targeting the highest-impact friction point first, proving the value, then expanding.
-
Post-purchase is where ROI compounds. Acquisition optimization produces 25-40% improvements. Retention and expansion optimization—where most programs don't look—is where 65%+ MRR growth happens.
Ready to see your customer journeys the way your buyers actually experience them? ObserviX's Journey Mapping Tool connects your marketing, product, and sales data into a unified buyer view—with attribution modeling, stage-specific KPI tracking, and the account-level intelligence B2B teams need to understand every touchpoint from first impression to closed deal.