How to Calculate ROAS: Formula, Examples, and Benchmarks
59% of CMOs admit they're scaling campaigns on misleading metrics (Gartner Marketing Analytics, 2024). Not bad creative. Not wrong targeting. Misleading measurements — the numbers they trusted most, built into dashboards, presented to boards every quarter.
Return on Ad Spend is supposed to solve this. Spend money on ads, measure what comes back, decide what to fund. But between platform overcounting, hidden costs, and attribution models that quietly shift reported numbers by 35–63%, most teams are making budget decisions on figures that don't reflect reality. Get ROAS right, and you know which campaigns to scale. Get it wrong, and confident decisions get built on fiction.
1. What Is ROAS?
ROAS measures how much revenue you generate for every dollar spent on advertising. Ad spend goes in, revenue comes out.
The core goal? Know whether your ads are earning more than they cost — before committing more budget.
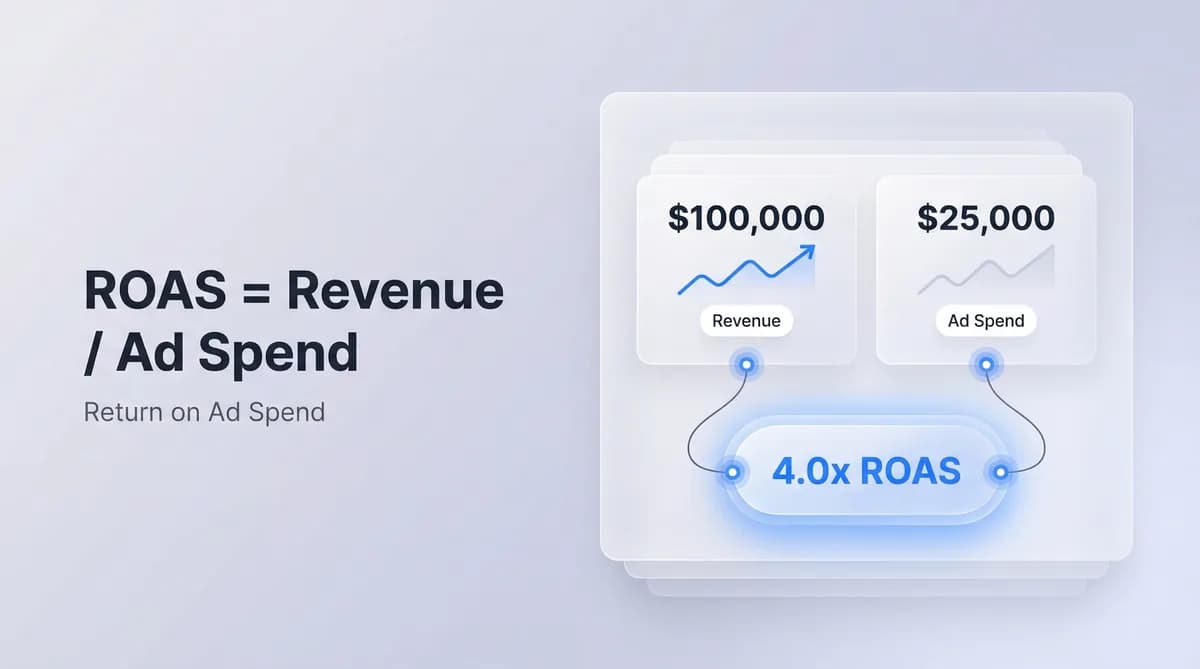
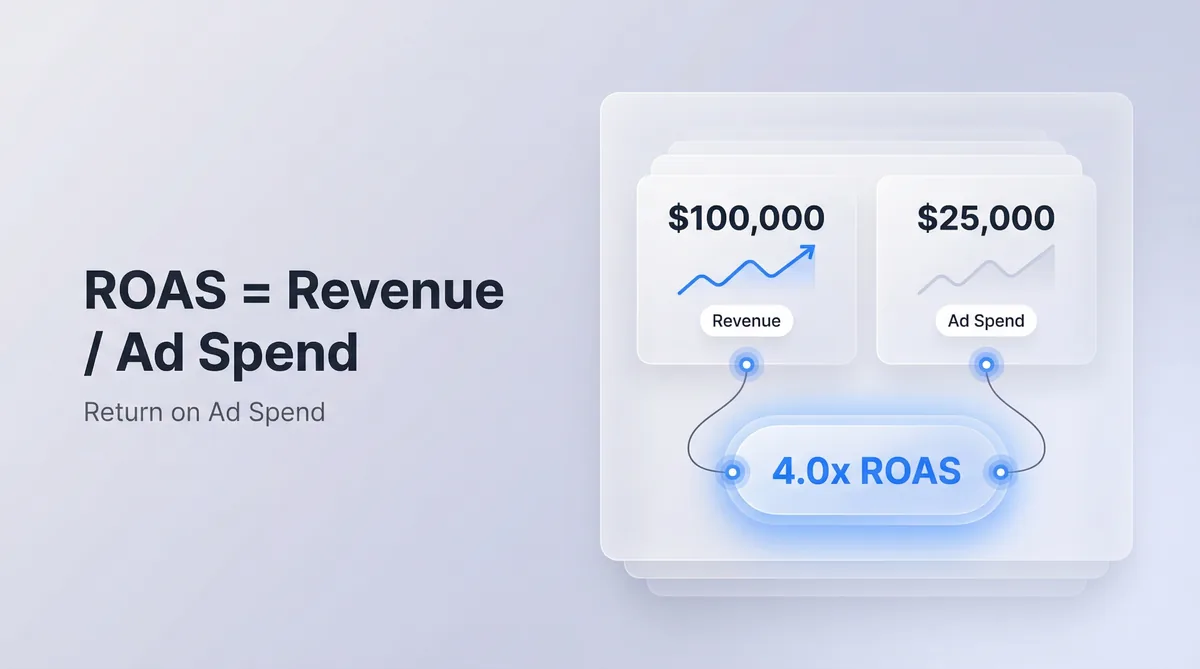
ROAS = Revenue from Ad Spend / Total Ad Spend
Spend $1,000 on Google Ads, generate $4,000 in revenue — your ROAS is 4.0x. You'll see this as a multiplier (4x), ratio (4:1), or percentage (400%). Different formats, identical meaning.
What ROAS doesn't tell you: whether you're actually profitable. A 5x ROAS can still produce a negative ROI once cost of goods, fulfillment, and overhead enter the picture. A dropshipping brand at 25% gross margins needs 4.0x ROAS just to break even — so a 3x that looks solid in the dashboard is a loss on every order. That distinction matters more than most teams realize, and most ROAS discussions skip past it entirely. Step 3 fixes that.
2. Why ROAS Matters — and When to Use It
It reveals which channels are actually working. Meta and Google both claim credit for the same conversions — independently, simultaneously. This attribution overlap inflates platform-reported ROAS by 40–60% (verified across 4 independent sources). Accurate ROAS cuts through that noise.
It drives budget decisions. When Google Search delivers 5.17x ROAS and TikTok delivers 1.41x (Triple Whale, 2025), that's a reallocation conversation grounded in data — not a gut-feel debate in a Monday planning meeting.
It connects marketing to finance. 74% of CMOs face pressure to prove ROI to their boards (Gartner, 2024). ROAS is often the fastest, most defensible number available for that conversation, because finance understands revenue-per-dollar-spent in a way they rarely understand impression share or click-through rates.
When should you use it? ROAS fits direct-response campaigns, channel comparisons, and automated bid strategy optimization. It's the wrong tool when your sales cycle runs 90+ days — use LTV:CAC instead, since ROAS can't capture value from deals that close months after initial contact. And it won't tell you whether the whole business is profitable. That's ROI's job.
Translation: ROAS is tactical. Precise and indispensable — in the right context. Don't ask it to answer questions it was never built to answer.
3. The ROAS Formula: Step-by-Step
Step 1: Use Net Revenue
Pull revenue directly attributable to your ads — from your ad platform, GA4, or CRM. Critical detail most teams miss: use net revenue after returns, not gross revenue.
This matters enormously in high-return categories. Fashion eCommerce often sees 30%+ return rates. At that level, gross ROAS overstates performance by 30–40%. A campaign appearing to return $40,000 might actually deliver $28,000 once returns settle. Those aren't the same decision.
Step 2: Include All Advertising Costs
Most teams stop at media spend. That's exactly where the calculation breaks.
True ROAS = Revenue / (Ad Spend + Agency Fees + Creative Costs + Tech Stack)
Excluding non-media costs inflates reported ROAS by 20–40% (Gartner, Deloitte). The math once you lay it out: a campaign with $10,000 in media spend, $2,000 in agency fees, and $500 in creative isn't a $10,000 campaign. It's a $12,500 campaign. That shifts ROAS from 4.0x to 3.2x — and at tight margins, shifts whether it was worth running at all.
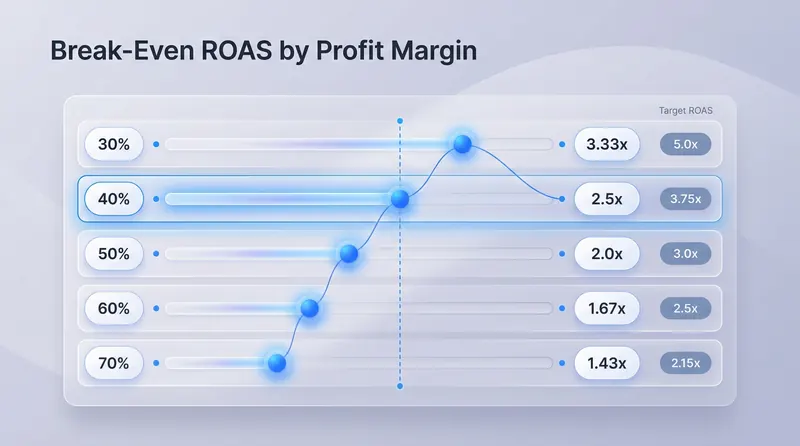
Step 3: Calculate Break-Even ROAS
Most ROAS guides skip this step. Don't.
Break-Even ROAS = 1 / Gross Profit Margin
| Gross Profit Margin | Break-Even ROAS | Target ROAS (1.5x safety buffer) |
|---|---|---|
| 30% | 3.33x | 5.0x |
| 40% | 2.5x | 3.75x |
| 50% | 2.0x | 3.0x |
| 60% | 1.67x | 2.5x |
| 70% | 1.43x | 2.15x |
Sources: FirstPageSage, Gartner, Dreamdata. eCommerce avg gross margin: 41.54% (2025).
Here's what this looks like in practice. A dropshipping brand consistently hitting 3:1 ROAS looked like acceptable performance. At 25% gross margin, break-even is 4.0x — meaning they were losing money on every single order, and the dashboard was never going to flag it because revenue exceeded spend. The 3x was real. The profit wasn't.
Your real target at 40% gross margin: 3.75x–5.0x (Brad Geddes, PPC Authority). Not the platform recommendation. Your margin math, calculated before any campaign launches.
4. Best Practices
Standardize attribution windows before comparing platforms. Meta defaults to 7-day click + 1-day view. Google defaults to 30-day click. Compare performance across both platforms without normalizing those windows, and you're measuring different standards — not different performance. Any conclusion you draw from that comparison will be wrong in ways that aren't obvious until a budget reallocation goes badly.
Atrantil found this firsthand. A single missing connection between GA4 and Google Ads was distorting their entire measurement picture. They fixed the integration. Measured ROAS jumped 36% in one month — not because campaigns improved, but because measurement finally reflected what was actually happening.
Use multi-touch attribution. Attribution model choice shifts ROAS by 35–63% (Kellogg School / Albertsons Study, 2023). That's large enough to reverse major budget decisions. Teams using multi-touch see 37% higher marketing ROI than last-click users (Marketing Evolution, 2024) — because they stop optimizing toward the wrong touchpoints. Our guide to marketing attribution models breaks down how each model distributes credit and which campaigns benefit most from each approach.
Segment by geography and margin tier. Blended numbers hide gaps that drive real decisions. Fluf Bags ran identical campaigns in the US and Canada. US ROAS: 15.80x. Canada ROAS: 11.18x. A 41% performance gap — completely invisible in blended totals, which means budget allocation based on aggregate numbers would have been wrong for both markets simultaneously.
5. Common Mistakes to Avoid
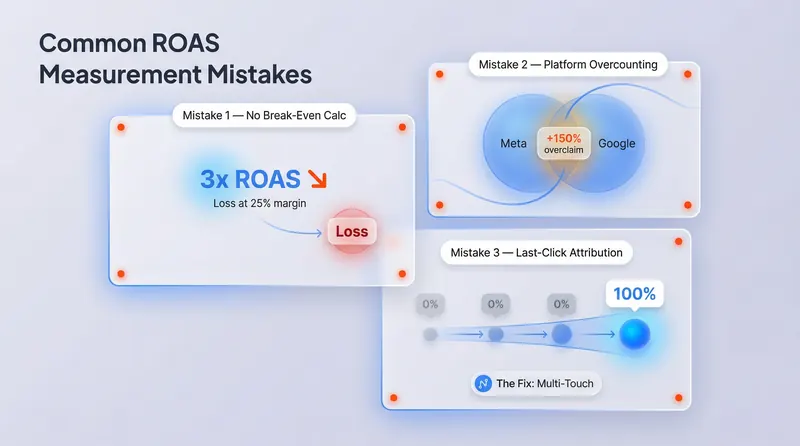
Mistake 1: Setting ROAS targets without calculating break-even first.
A 3x ROAS sounds solid. At 25% gross margins, it's a loss. The number needs margin context before it means anything at all.
The fix: Calculate 1 / Gross Profit Margin before any campaign launches. That's the floor — the minimum ROAS required to exist as a business. Build targets up from there, not down from what the platform suggests.
Mistake 2: Trusting platform-reported ROAS at face value.
Meta reports its ROAS. Google reports its ROAS. Both claim credit for the same conversions — simultaneously, independently, following their own attribution logic. Run both platforms across the same campaigns and combined reported conversions can overstate actual results by 150–200%.
The fix: De-duplicate with a third-party attribution tool. 71% of advertisers rank incrementality testing as their top measurement priority in 2025 (Industry Research). That number keeps rising because teams are finally catching on to how aggressively platforms overclaim.
Mistake 3: Using last-click attribution for full-funnel campaigns.
Last-click gives 100% credit to the final touchpoint before conversion. Everything upstream — awareness content, early-funnel display, email sequences that built trust over weeks of nurture — registers at zero contribution. You optimize accordingly. You cut the wrong things.
The fix: Switch to multi-touch attribution. Scandinavian Airlines changed nothing about their campaigns — same spend, same creative, same targeting. They only changed the attribution model. Measured ROAS increased 93% in the US and 47% in the UK. The performance had always been there. The measurement just couldn't see it. For a practical walkthrough of implementing multi-touch measurement, see our guide on how to measure marketing attribution.
6. ROAS vs. ROI vs. CPA
| Metric | Formula | What It Measures | Best For |
|---|---|---|---|
| ROAS | Revenue / Ad Spend | Ad revenue efficiency | Campaign optimization |
| ROI | (Net Profit / Total Cost) × 100% | Total business profitability | Strategic decisions |
| CPA | Ad Spend / Conversions | Cost per acquisition | Lead gen, SaaS |
ROAS is tactical. ROI is strategic. CPA is conversion-focused.
A campaign can show excellent ROAS and still produce negative ROI when cost of goods and overhead are high. That's not a theoretical edge case — 59% of CMOs admit scaling on misleading metrics (Gartner, 2024). Most are using ROAS alone where they need ROI calculated alongside it to understand whether those campaigns are actually building the business. For a complete framework on measuring and improving marketing ROI, see our marketing ROI guide for 2025.
Use all three. Let each answer the question it's designed for.
7. 2025 ROAS Benchmarks by Platform
| Platform | Median ROAS | Notes |
|---|---|---|
| Google Search Ads | 5.17x | Highest-intent placements |
| Google Ads (overall) | 3.31x | Blended search, display, shopping |
| Meta (overall) | 2.19x | Retargeting reaches 3.61x |
| TikTok Ads | 1.41x | Value optimization reaches 2.25x |
| LinkedIn Ads | 1.13x | Low ROAS; high B2B pipeline value |
Sources: Triple Whale, Enrich Labs, Dreamdata, 2025.
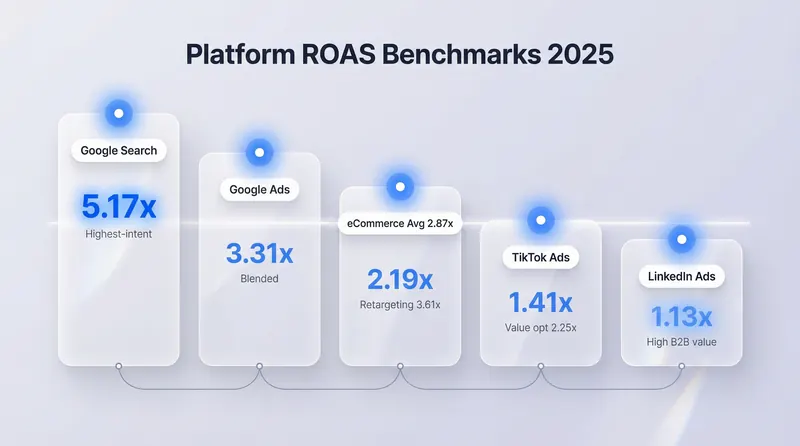
Context matters for all of these. eCommerce averages 2.87x in 2025 — down from 3.5x+ in prior years, with a realistic target of 4.0x+ once margin structure is factored in. B2B SaaS averages 2.6x (target: 3.0x). Retail and DTC runs 2.0–3.5x depending on margin tier and channel mix (Upcounting, Triple Whale, Gartner, 2025).
The most important benchmark is your own break-even number. Industry averages don't account for your specific margins or channel mix — they're a reference point for what's plausible in your category, not a target to optimize toward.
8. Real-World Example: Scandinavian Airlines
SAS ran digital advertising across Europe with last-click as the measurement standard. Under that model, bottom-funnel ads appearing just before ticket purchase received 100% of the credit. Display and video campaigns that had built awareness weeks earlier — the campaigns that moved audiences from unfamiliar to genuinely interested — registered near-zero ROAS. On paper, they looked like waste.
Working with Merkle, SAS replaced last-click with a custom multi-touch model. Same campaigns. Same spend. Same creative. Same audiences. Nothing changed except how credit was assigned.
Result: US market ROAS +93%. UK market ROAS +47%.
No budget increase. No campaign restructuring. The performance gap existed entirely in how measurement was assigned — not in what the campaigns were doing.
Translation: it wasn't a campaign problem. It was a measurement problem.
Kellogg School of Northwestern University's research on Albertsons confirmed the same pattern at scale: attribution model choice shifts ROAS by 35–63% across a large advertiser's campaign portfolio. That's not an outlier from one airline's unusual funnel. It's the default condition for any team that hasn't audited how their platforms assign conversion credit.
9. Key Takeaways
- ROAS = Revenue / Ad Spend — expressed as a multiplier (4x), ratio (4:1), or percentage (400%). Pick a format and stay consistent across your reporting.
- Calculate break-even ROAS before setting targets:
1 / Gross Profit Margin. A 3x ROAS is profitable at 50% margin and a loss at 25%. - Platform-reported ROAS overstates true performance by 40–200% due to attribution overlap. De-duplicate before making budget decisions.
- Attribution model choice shifts ROAS by 35–63% — Scandinavian Airlines gained 93% more measured ROAS in the US without changing a single campaign element.
- True ROAS includes all costs — media spend, agency fees, creative production, and tech stack. Omitting them inflates reported ROAS by 20–40%.
Most ROAS problems aren't bid problems or budget problems. They're measurement problems — and measurement problems are fixable once you know where the distortion is coming from.
ObserviX connects your ad spend across Google, Meta, LinkedIn, and TikTok into a single attribution view: True ROAS with all costs factored in, cross-platform conversions de-duplicated, and your real break-even threshold surfaced automatically.
Try the ObserviX ROAS Calculator and see what your campaigns are actually returning.