
Introduction
58% of marketing leaders are scaling campaigns on misleading metrics right now. Not because they're careless — because ROAS and ROI look nearly identical, and the difference only becomes visible when it's expensive to fix.
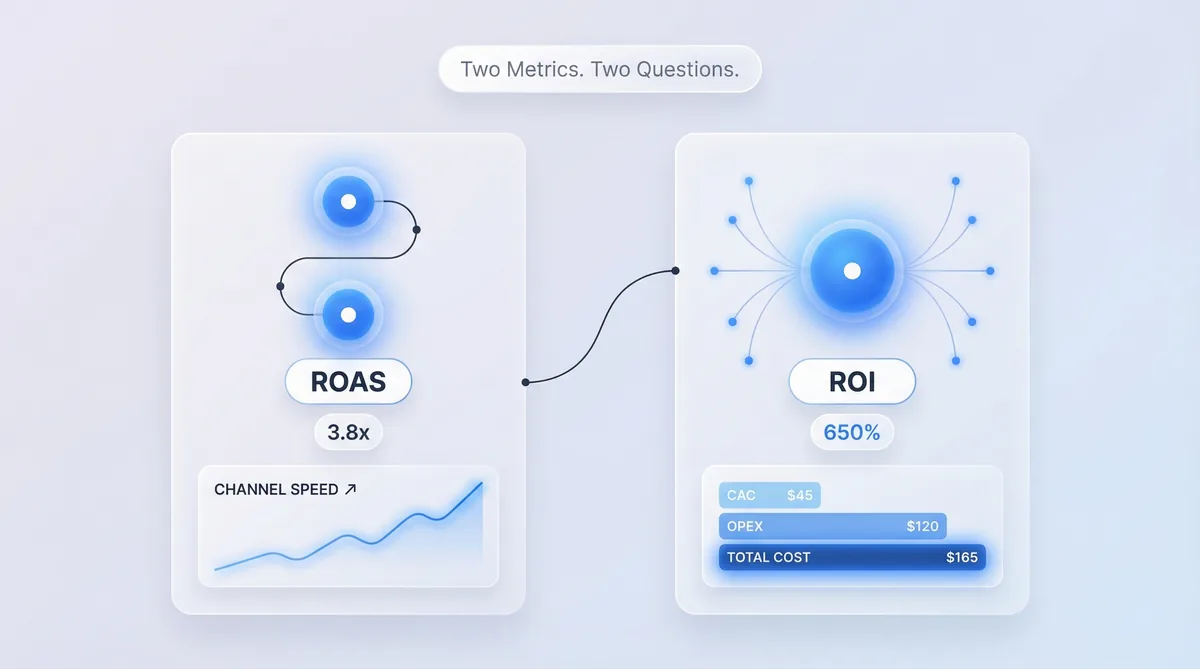
Here's what actually happens every quarter: a campaign reports a 5x ROAS, spend gets approved, and three months later the P&L shows a loss. The metric wasn't lying. It just wasn't telling the whole story. Two metrics, two completely different questions — and most teams treat them as interchangeable.
1. What Is ROAS?
Return on Ad Spend (ROAS) measures how much revenue you generate per dollar of advertising.
ROAS = Revenue from Ads / Total Ad Spend
Spend $1,000 on Google Ads, generate $3,000 in revenue — ROAS is 3.0x. Clean, fast, built for media buyers who need to act today, not next week.
The core goal? Know whether a specific campaign is generating enough revenue to justify its ad cost.
ROAS is a channel-level, tactical metric — built for daily and weekly campaign decisions. What it doesn't see: cost of goods, fulfillment, salaries, agency fees. Anything beyond the media budget itself is invisible to it.
2025 platform benchmarks: Google Ads: 3.31x (Search: 5.17x) | Meta: 2.19x (Retargeting: 3.61x) | TikTok: 1.41x | LinkedIn: 1.13x
LinkedIn's 1.13x looks weak against Google's 3.31x. That comparison is misleading — and it's exactly where confusing ROAS with ROI causes expensive strategic mistakes.
2. What Is ROI?
Return on Investment (ROI) measures true profitability after accounting for every cost.
ROI = (Revenue − Total Cost) / Total Cost × 100%
Total cost means everything: ad spend, COGS, fulfillment, salaries, tools, agency retainer. All of it. No exceptions.
The core goal? Understand whether marketing is genuinely profitable — not just whether ads generate revenue.
ROI is what CFOs require. What boards evaluate. What determines next year's budget. 83% of CMOs feel pressure to prove marketing impact (Gartner 2024), but most of what gets reported upward is ROAS — which doesn't answer the profitability question at all.
Translation: you're defending channel efficiency when the room wants to know about profit.
3. Why This Distinction Matters
A campaign can have excellent ROAS and still lose money. Here's the proof.
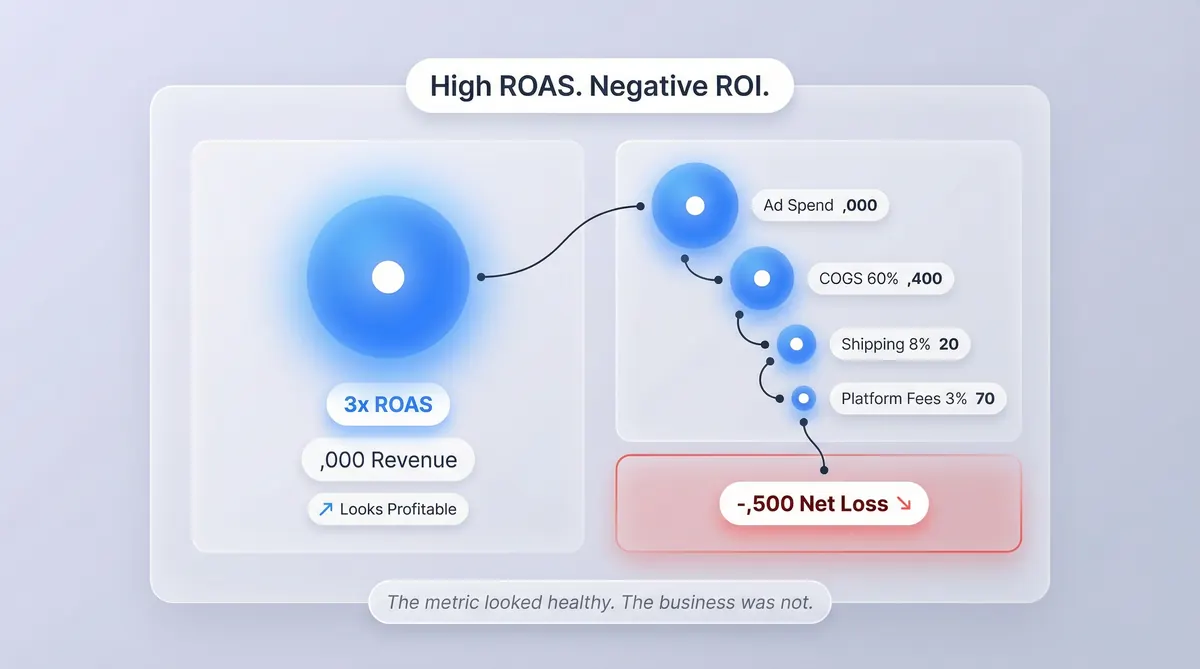
A dropshipping company ran ads with a 3:1 ROAS — $9,000 revenue on $3,000 ad spend. Product cost: 60% of revenue. Shipping: 8%. Platform fees: 3%. Net result: -$1,500 in actual profit.
The metric looked healthy. The business wasn't. That's the ROAS profitability paradox.
Three structural reasons this keeps happening:
ROAS ignores cost structure. A 4.0x ROAS on a 20% gross margin still loses money at scale — there's no mechanism to account for what it actually costs to deliver that revenue.
Platform ROAS is overstated by 40–150%. Media Mix Modeling studies (N=310 advertisers, 2024) show platforms inflate ROAS because they attribute conversions that would have happened anyway. Every platform claims maximum credit. Every one.
Privacy changes broke attribution accuracy. iOS 14.5 caused Facebook's reported ROAS to drop 38.41% when measured independently — while actual sales declined far less. The dashboard was always the platform's best case, not reality.
4. When to Use ROAS vs ROI
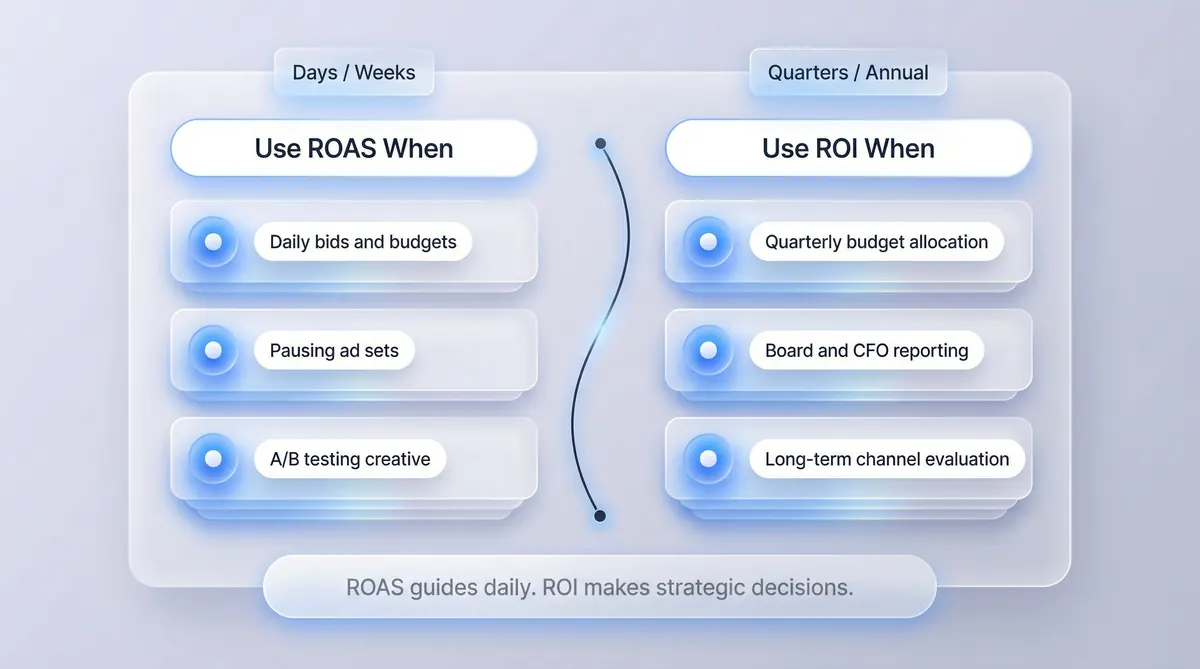
Use ROAS when you're making daily campaign decisions — bids, budgets, pausing ad sets, A/B testing creative. It's built for fast, channel-level feedback loops.
Use ROI when allocating quarterly or annual budget, reporting to the C-suite or board, or evaluating whether to keep investing in a channel long-term. It's the metric that survives CFO scrutiny.
Use Break-Even ROAS before scaling anything. Scaling a campaign below 1 / gross margin multiplies losses, not revenue. That's not a warning — it's arithmetic.
The practical rule: ROAS guides daily decisions. ROI makes strategic ones. Use both. Don't confuse them.
5. How to Calculate Each
Calculating ROAS
Revenue attributed to the campaign divided by total ad spend. Example: $12,400 / $3,200 = 3.88x
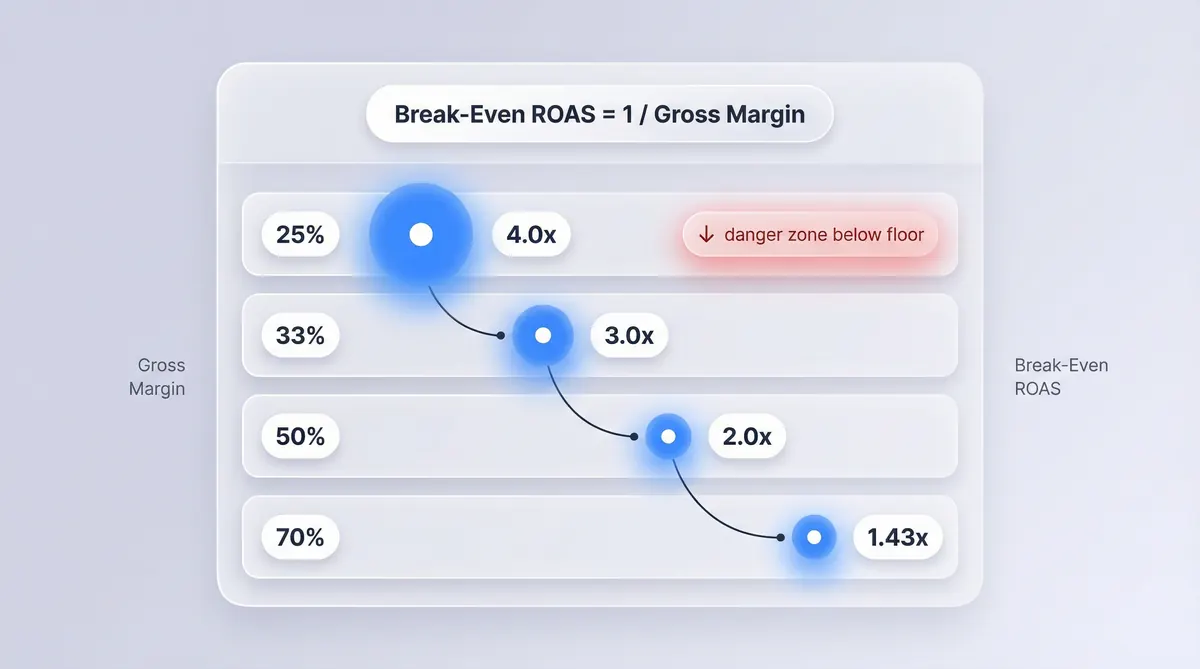
Break-Even ROAS = 1 / Gross Profit Margin — the number most teams never calculate. Until they have to.
| Gross Margin | Break-Even ROAS |
|---|---|
| 25% | 4.0x |
| 33% | 3.0x |
| 50% | 2.0x |
| 70% (SaaS) | 1.43x |
Below break-even? You're losing money — regardless of what the platform shows.
Calculating ROI
(Revenue − Total Cost) / Total Cost × 100%. Total cost includes ad spend, COGS, salaries, tools, and agency fees.
Example: $72,000 revenue, $18,000 total costs → 300% ROI
Translation: for every dollar invested, you returned three — including profit.
6. Best Practices
Set channel-specific ROAS targets — not universal benchmarks. Break-even ROAS is the floor. Set targets 1.5–2x above it. Then adjust for attribution windows: a 7-day vs. 28-day window produces dramatically different numbers for the same campaign. Validate with incrementality testing — 71% of advertisers rank it their top 2025 KPI because platform ROAS doesn't prove ads actually caused conversions. It just claims they did.
Include every cost in ROI. Partial-cost ROI won't survive CFO scrutiny. Align marketing and finance on attribution methodology — companies where CMOs and CFOs share the same measurement framework grow EBITDA 12% faster (Deloitte 2024). Switch to multi-touch attribution: 37% more accurate ROI, yet 67% of B2B teams still default to last-touch (2024, N=890 marketers). For a step-by-step framework on building that measurement foundation, see our guide to measuring marketing ROI.
Use MER as a portfolio health signal. MER = Total Revenue / Total Marketing Spend. Target 3.0 or above. It cuts through platform attribution noise, aligns directly with P&L reality, and it's increasingly the preferred metric for CFO-level reporting — especially now that cookie-based attribution is unreliable.
7. Common Mistakes to Avoid
1. Scaling without calculating break-even ROAS first.
A 3x ROAS target sounds reasonable — until you discover your gross margin is 25%, making 4.0x the actual floor. Below that? Every dollar you scale is a dollar you lose faster. The fix: Run 1 / gross margin before setting any target. Pin it to every campaign dashboard so the team can't miss it.
2. Trusting platform ROAS as ground truth.
Meta, Google, and TikTok routinely claim the same conversion — overstating performance by 40–150%. They're not lying, technically. They're just measuring themselves. There's a difference. The fix: Do a quarterly revenue reconciliation against your CRM. The gap between platform ROAS and CRM reality is your inflation factor. Track it.
3. Using ROAS to cut non-paid channels.
Email generates $36 per $1 invested (3,600% ROI, HubSpot 2024). SEO averages 748% ROI. Neither has an ad spend denominator — ROAS is undefined for them, so using it to justify cutting content or email budgets is a category error. Full stop. The fix: Apply ROI to channels with long feedback loops. ROAS is for paid media only.
4. Reporting ROAS to the CFO as a profitability signal.
A 6x ROAS with thin margins and high overhead can still produce flat or negative ROI. CFOs think in EBITDA — ROAS doesn't map to that model. At all. The fix: Lead executive reporting with ROI and MER. ROAS belongs in channel-level appendices, not board decks. Understanding how to measure marketing attribution accurately is what closes the gap between what platforms report and what the P&L reflects.
8. ROAS vs ROI: Side-by-Side
| Dimension | ROAS | ROI |
|---|---|---|
| What it measures | Ad revenue efficiency | Total marketing profitability |
| Formula | Revenue / Ad Spend | (Revenue − All Costs) / All Costs × 100% |
| Costs included | Ad spend only | Ad spend + COGS + salaries + overhead |
| Time horizon | Days / weeks | Quarters / annual |
| Who uses it | Media buyers | CMOs, CFOs, boards |
| Best paired with | Break-even ROAS | MER, LTV:CAC |
9. Real-World Example: TripMaster's 650% ROI
TripMaster, a B2B SaaS platform, had paid search ROAS at 3.8x — solid by platform metrics. Their 6–9 month sales cycle, though, meant last-touch attribution was crediting paid search for deals that originated from LinkedIn and content months earlier. The paid search team looked like heroes. They weren't the only ones doing the work.
When TripMaster shifted to full-funnel ROI with multi-touch attribution — comparing the different marketing attribution models before choosing the right fit — the reality emerged: content and LinkedIn were driving 42% of pipeline that paid search had been claiming. After reallocating $80,000 to mid-funnel content and LinkedIn ABM:
- ARR reached $504,758; ROI reached 650%
- Qualified leads grew 41% in 6 months
- Sales cycle shortened 23%
ROAS on paid campaigns actually declined during this period. Optimizing for ROAS alone would have defunded TripMaster's most profitable growth channels.
ROAS said double down on paid search. ROI said diversify. ROI won.
Key Takeaways
- ROAS measures ad revenue efficiency; ROI measures total marketing profitability. They answer different questions — never use them interchangeably.
- Calculate break-even ROAS before setting any target (1 / gross margin). A 3x ROAS is break-even at 33% margins, profitable at 60%, and loss-making at 25%.
- Platform ROAS overstates true performance by 40–150%. Reconcile against your CRM — the dashboard number is the platform's best case.
- Use ROAS for tactical campaign decisions. Use ROI for strategic budget decisions. Match the metric to the decision horizon.
- MER (Total Revenue / Total Marketing Spend, target 3.0+) is the emerging portfolio metric — it bridges ROAS speed with ROI depth without requiring perfect attribution data.
Knowing the difference is step one. Acting on it is harder — it requires attribution infrastructure that connects ad platform data, CRM revenue, and cost accounting into one view. Without that, you're always defending a ROAS number to a CFO who thinks in profit margins.
ObserviX unifies campaign-level ROAS with full-funnel ROI reporting across your entire marketing stack.