See Every Step From First Click to Conversion
Map the complete customer journey across sessions, channels, and devices. Visual timelines show exactly how visitors become customers — which touchpoints matter, where they drop off, and what paths lead to revenue. No SQL. No BI tools. No guesswork.
Turn scattered touchpoints into a clear conversion story
Average touchpoints captured across the full customer journey
Find winning conversion paths before your competitors do
Replace manual journey analysis with automated visual timelines
Better understanding of what actually drives conversions
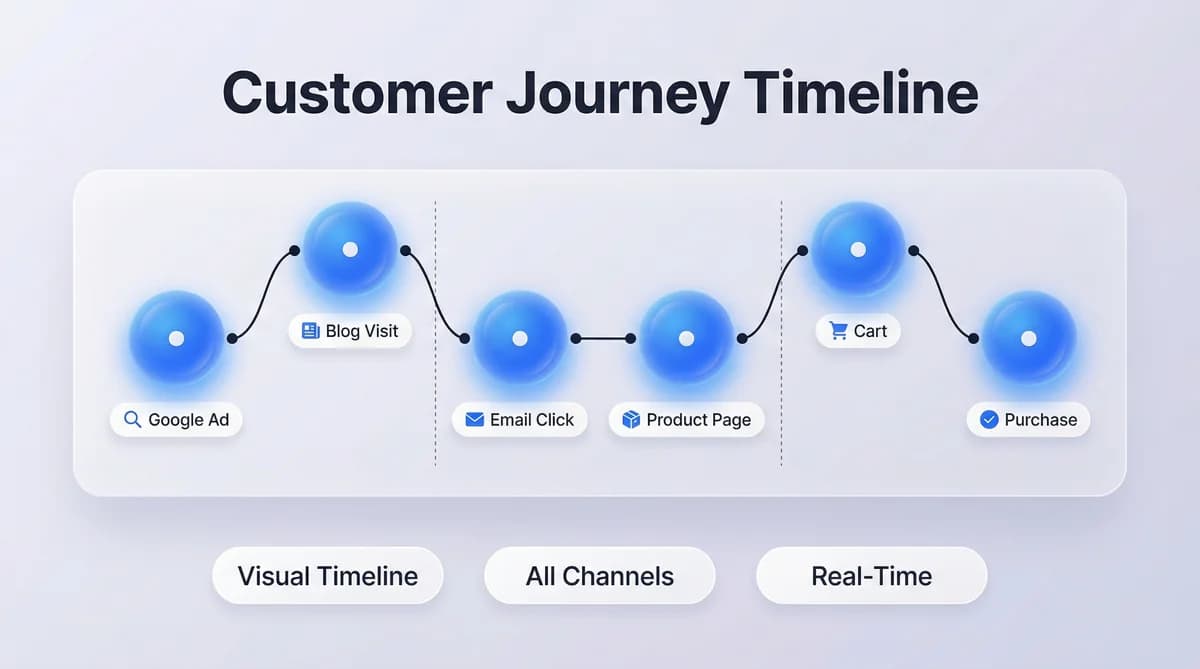
See the Complete Path From First Visit to Conversion
Most analytics tools show you isolated metrics — page views here, conversions there. ObserviX connects every interaction into a single visual timeline. See how a visitor discovered you through a Google ad, returned two days later from an email, browsed three product pages, and finally converted after clicking a retargeting ad on Instagram. Every session, every channel, every page — stitched together automatically. The timeline updates in real time, so you can watch active journeys unfold as they happen. Filter by conversion type, traffic source, or date range to find the patterns that matter.

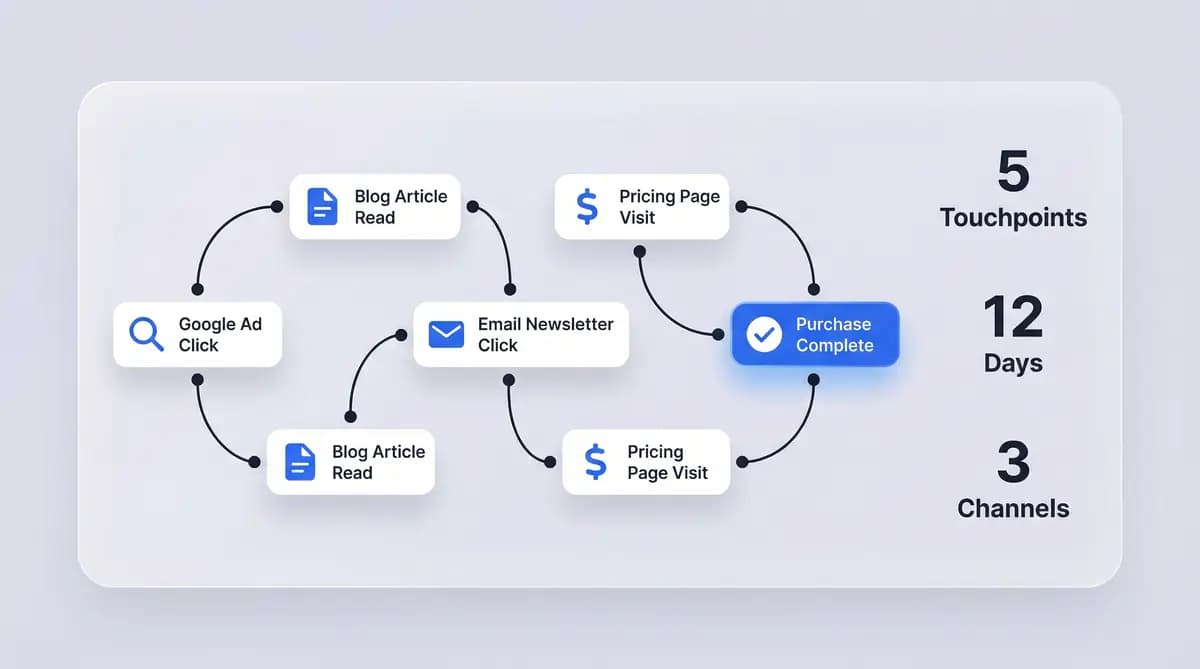
Track Visitors Across Sessions, Channels, and Devices
Customers don't convert in one visit. The average B2C journey spans 27+ touchpoints across multiple sessions, devices, and channels. ObserviX stitches these fragmented interactions into a unified view using first-party identity resolution. A visitor who clicks a Facebook ad on mobile, browses your blog on desktop the next day, and converts through an email link a week later appears as one continuous journey — not three separate sessions. No third-party cookies required. Cross-device matching works through your ObserviX Pixel with privacy-compliant first-party data.
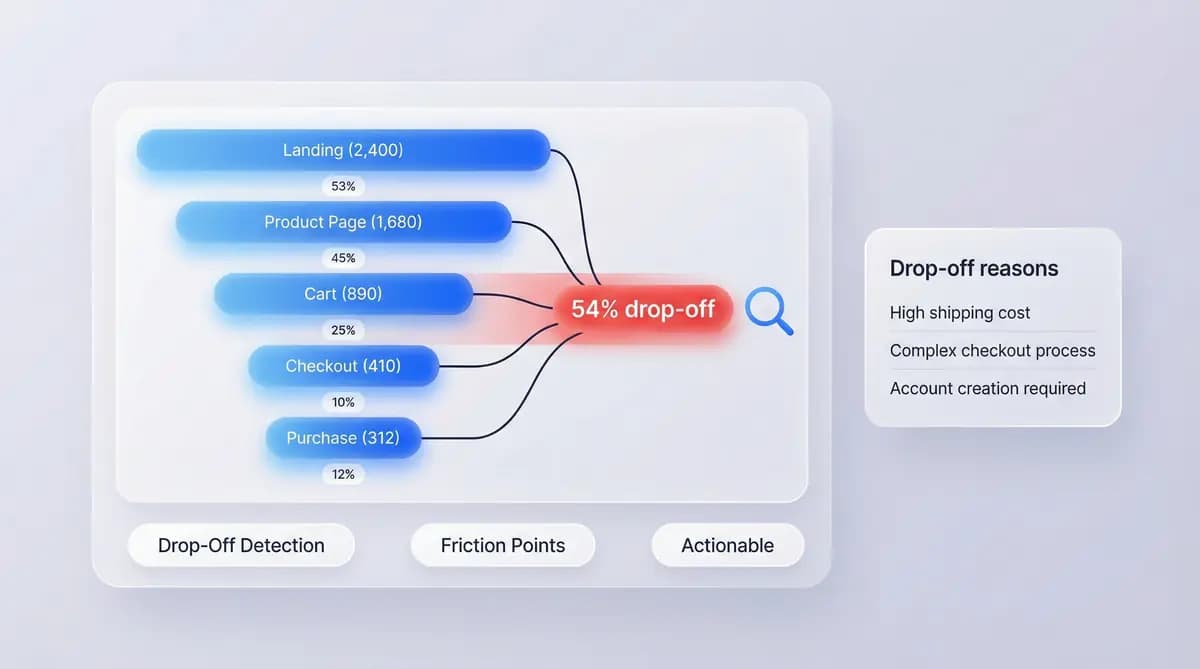
Find Where Visitors Drop Off and Fix It
Every funnel has leaks. ObserviX highlights the exact pages, steps, and transitions where potential customers disengage. See which landing pages have high entry rates but low progression. Identify checkout steps where abandonment spikes. Spot content gaps where visitors search for information and leave empty-handed. Drop-off analysis goes beyond simple funnel charts — it shows you the context. What did visitors do before they left? Which traffic sources produce visitors that drop off fastest? What's the last page they see before they're gone? Answer these questions in clicks, not queries.
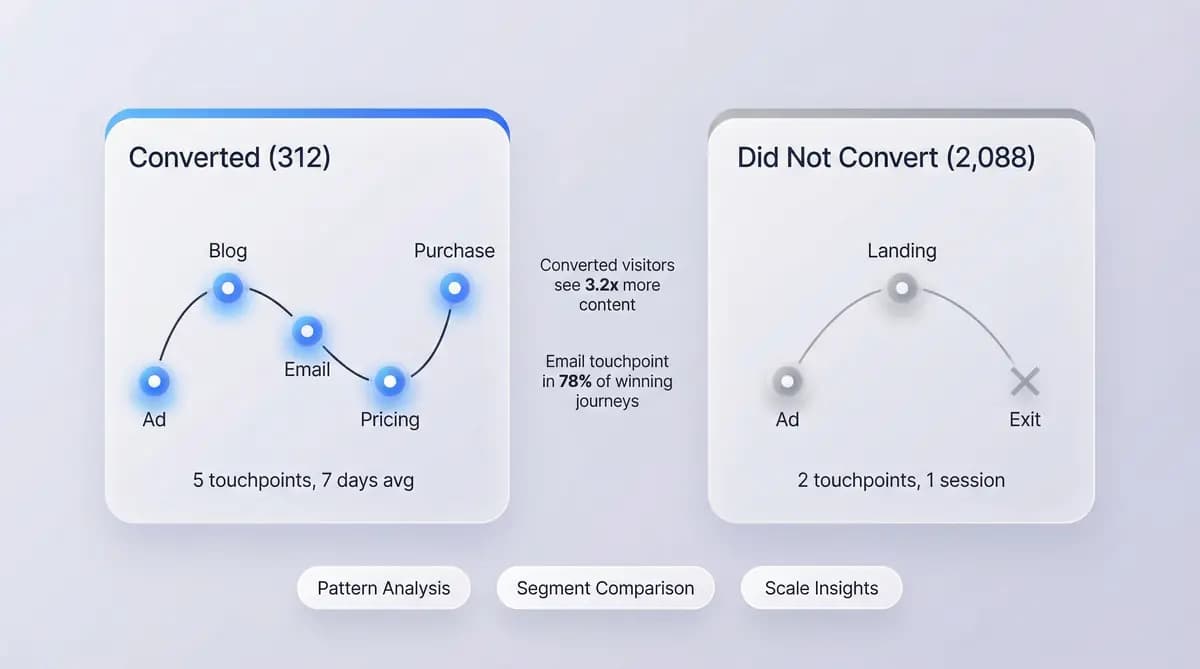
Compare Winning Journeys to Lost Opportunities
Side-by-side journey comparison shows the exact difference between visitors who convert and visitors who don't. See which content appears in successful journeys but is missing from failed ones. Discover the optimal number of touchpoints before conversion. Identify channels that warm up prospects versus channels that close deals. Pattern analysis across thousands of journeys reveals what works at scale — not just anecdotes from individual user recordings. Use these insights to redesign funnels, reallocate budget to high-performing channels, and create content that fills the gaps in your conversion paths.
Your data is already flowing. Connect the dots.
Customer Journey works with data already captured by the ObserviX Pixel and Web Analytics. No additional setup required if you're already tracking with ObserviX. Journey timelines populate automatically from your existing sessions, page views, UTM parameters, and conversion events. For teams adding ObserviX for the first time — install the Pixel, define your conversion goals, and see your first journey maps within 24 hours of data collection. Integrates with Shopify, WordPress, WooCommerce, and any platform that supports a JavaScript snippet.
- 1
Install the ObserviX Pixel
Copy the snippet into your site header. Works with Shopify, WordPress, WooCommerce, and any custom platform. Under 5 minutes.
- 2
Define your conversion goals
Use the visual Event Manager to mark the actions that matter — purchases, sign-ups, form submissions. No code required.
- 3
See your first journey maps
Journey timelines populate automatically within 24 hours. Sessions, channels, and conversion events stitched together.

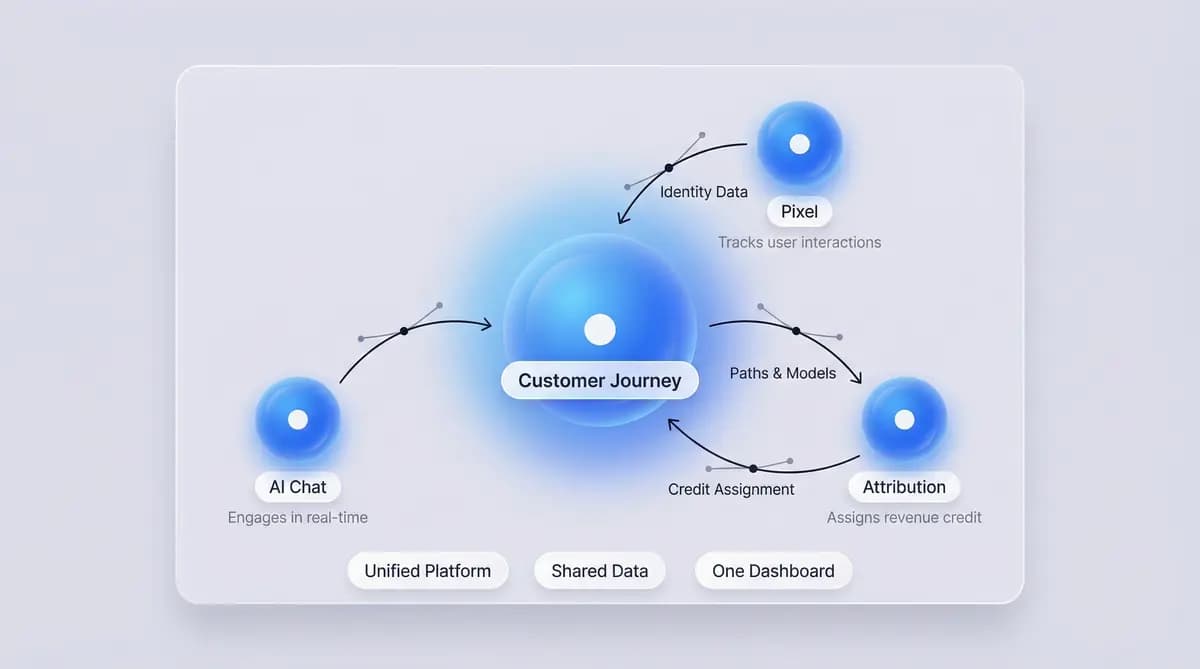
From individual visits to complete conversion stories
Customer Journey shows how visitors move through your site. Connect it to the full ObserviX platform and every journey gets richer — with identity, attribution, and AI-powered insights layered on top.
"Before ObserviX, we had no idea what happened between first click and conversion. We could see traffic and we could see sales, but the middle was a black box. Now we can see the exact journey our best customers take — and we've redesigned our entire funnel around it. Our conversion rate improved 34% in three months."

David Reinholt
VP of Growth, E-Commerce Platform
Frequently Asked Questions
Customer journey mapping is the process of visualizing every interaction a visitor has with your website and marketing channels — from the first touchpoint to conversion. ObserviX automatically captures page views, sessions, traffic sources, UTM parameters, and conversion events, then stitches them into visual timelines that show the complete path each visitor takes.
Funnel reports show you a fixed sequence of steps and where visitors drop off between them. Customer journey maps show the actual paths visitors take — including the steps you didn't plan for. Visitors rarely follow a linear funnel. They browse, leave, come back, explore different pages, and convert through unexpected paths. Journey mapping captures this real behavior.
ObserviX uses the first-party Pixel to maintain visitor identity across sessions and devices. When a visitor returns to your site — even on a different device — ObserviX recognizes them and appends the new session to their existing journey timeline. This uses first-party data only, with no third-party cookies.
There is no limit on touchpoints per journey. ObserviX captures every page view, session start, UTM parameter, referral source, and conversion event. The average customer journey in our data spans 27+ touchpoints, but some complex B2C journeys exceed 50 touchpoints across multiple weeks.
Yes. The Pixel is what enables cross-session and cross-device identity resolution. Without it, ObserviX can show individual session paths using Web Analytics data, but cannot stitch multiple sessions into a unified customer journey. The Pixel installs in under 5 minutes.
Yes. Filter journeys by traffic source, conversion type, device, geographic region, or custom UTM parameters. Compare the journeys of visitors who convert versus those who don't, or compare journeys from different campaigns to see which produces the best paths to conversion.
Journey maps start populating as soon as the Pixel captures its first sessions. You'll see individual session paths immediately. Cross-session journeys build over time as visitors return — typically within 24-72 hours you'll have enough data to identify initial journey patterns.
Yes. ObserviX uses first-party data collection only. The Pixel runs on your domain, and all data is stored on first-party infrastructure. Visitor identity resolution uses anonymized identifiers — no personal data is shared with third parties. You control data retention and can configure EU or US data processing.
Stop guessing. Start knowing. Take control of your marketing today.
Start your 14-day free trial and make data-driven decisions