See every touchpoint that leads to revenue
Last-click shows you the final step. ObserviX shows you the full journey — every channel, session, and device that turned a visitor into a customer.
Move your most important metrics with ObserviX
Hidden journey uncovered that last-click misses
Average budget reallocated to higher-performing channels
Average ROAS improvement with multi-touch
Pixel install to first attribution report
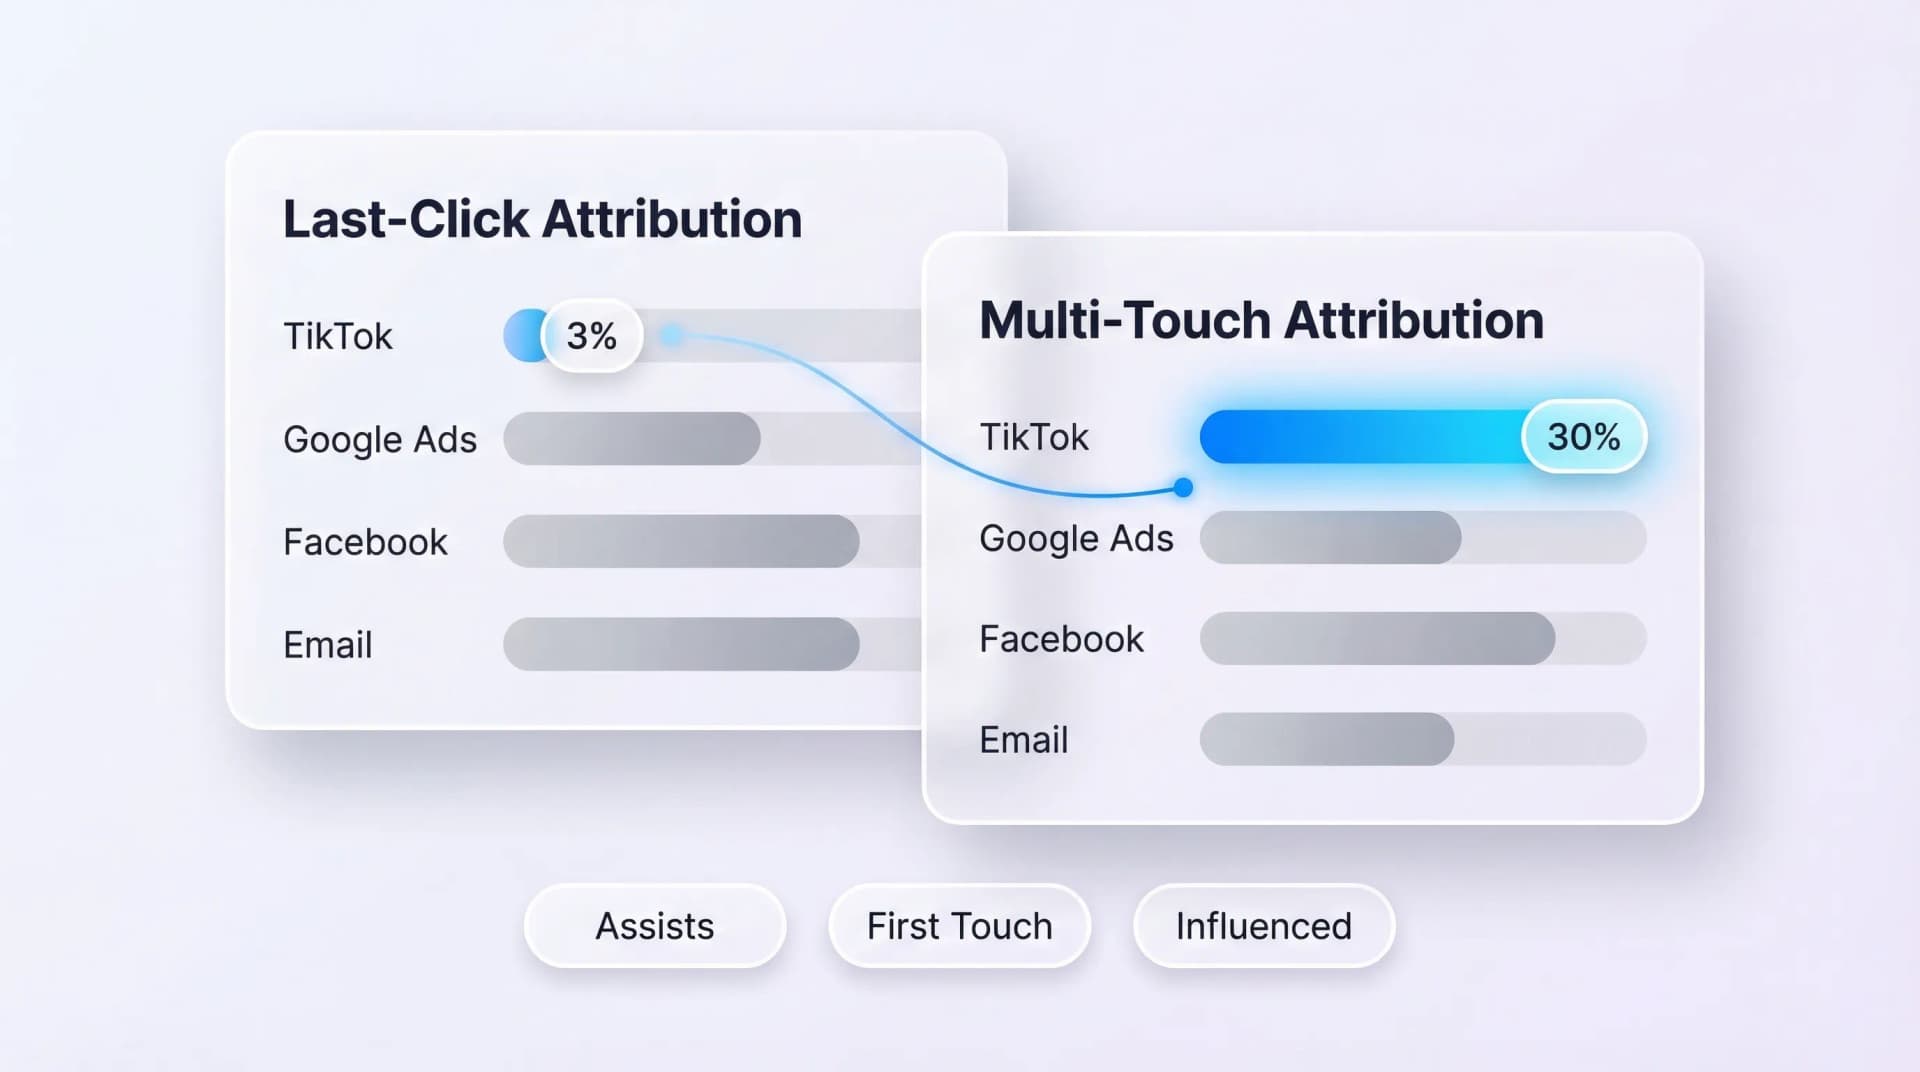
Last-click attribution is costing you more than you think
Last-click gives 100% credit to the final interaction. The blog post, email, and ad that built awareness? Invisible. You're funding closers and starving the channels that create demand. Cut the awareness channels it undervalues and in 60-90 days your pipeline dries up. By then, you've lost months of momentum. Meanwhile, Google claims $31K. Meta claims $42K. Your actual revenue: $55K. Both platforms count the same customer. You're budgeting on inflated numbers that never reconcile.
ObserviX shows every touchpoint that leads to revenue — not just the last click.
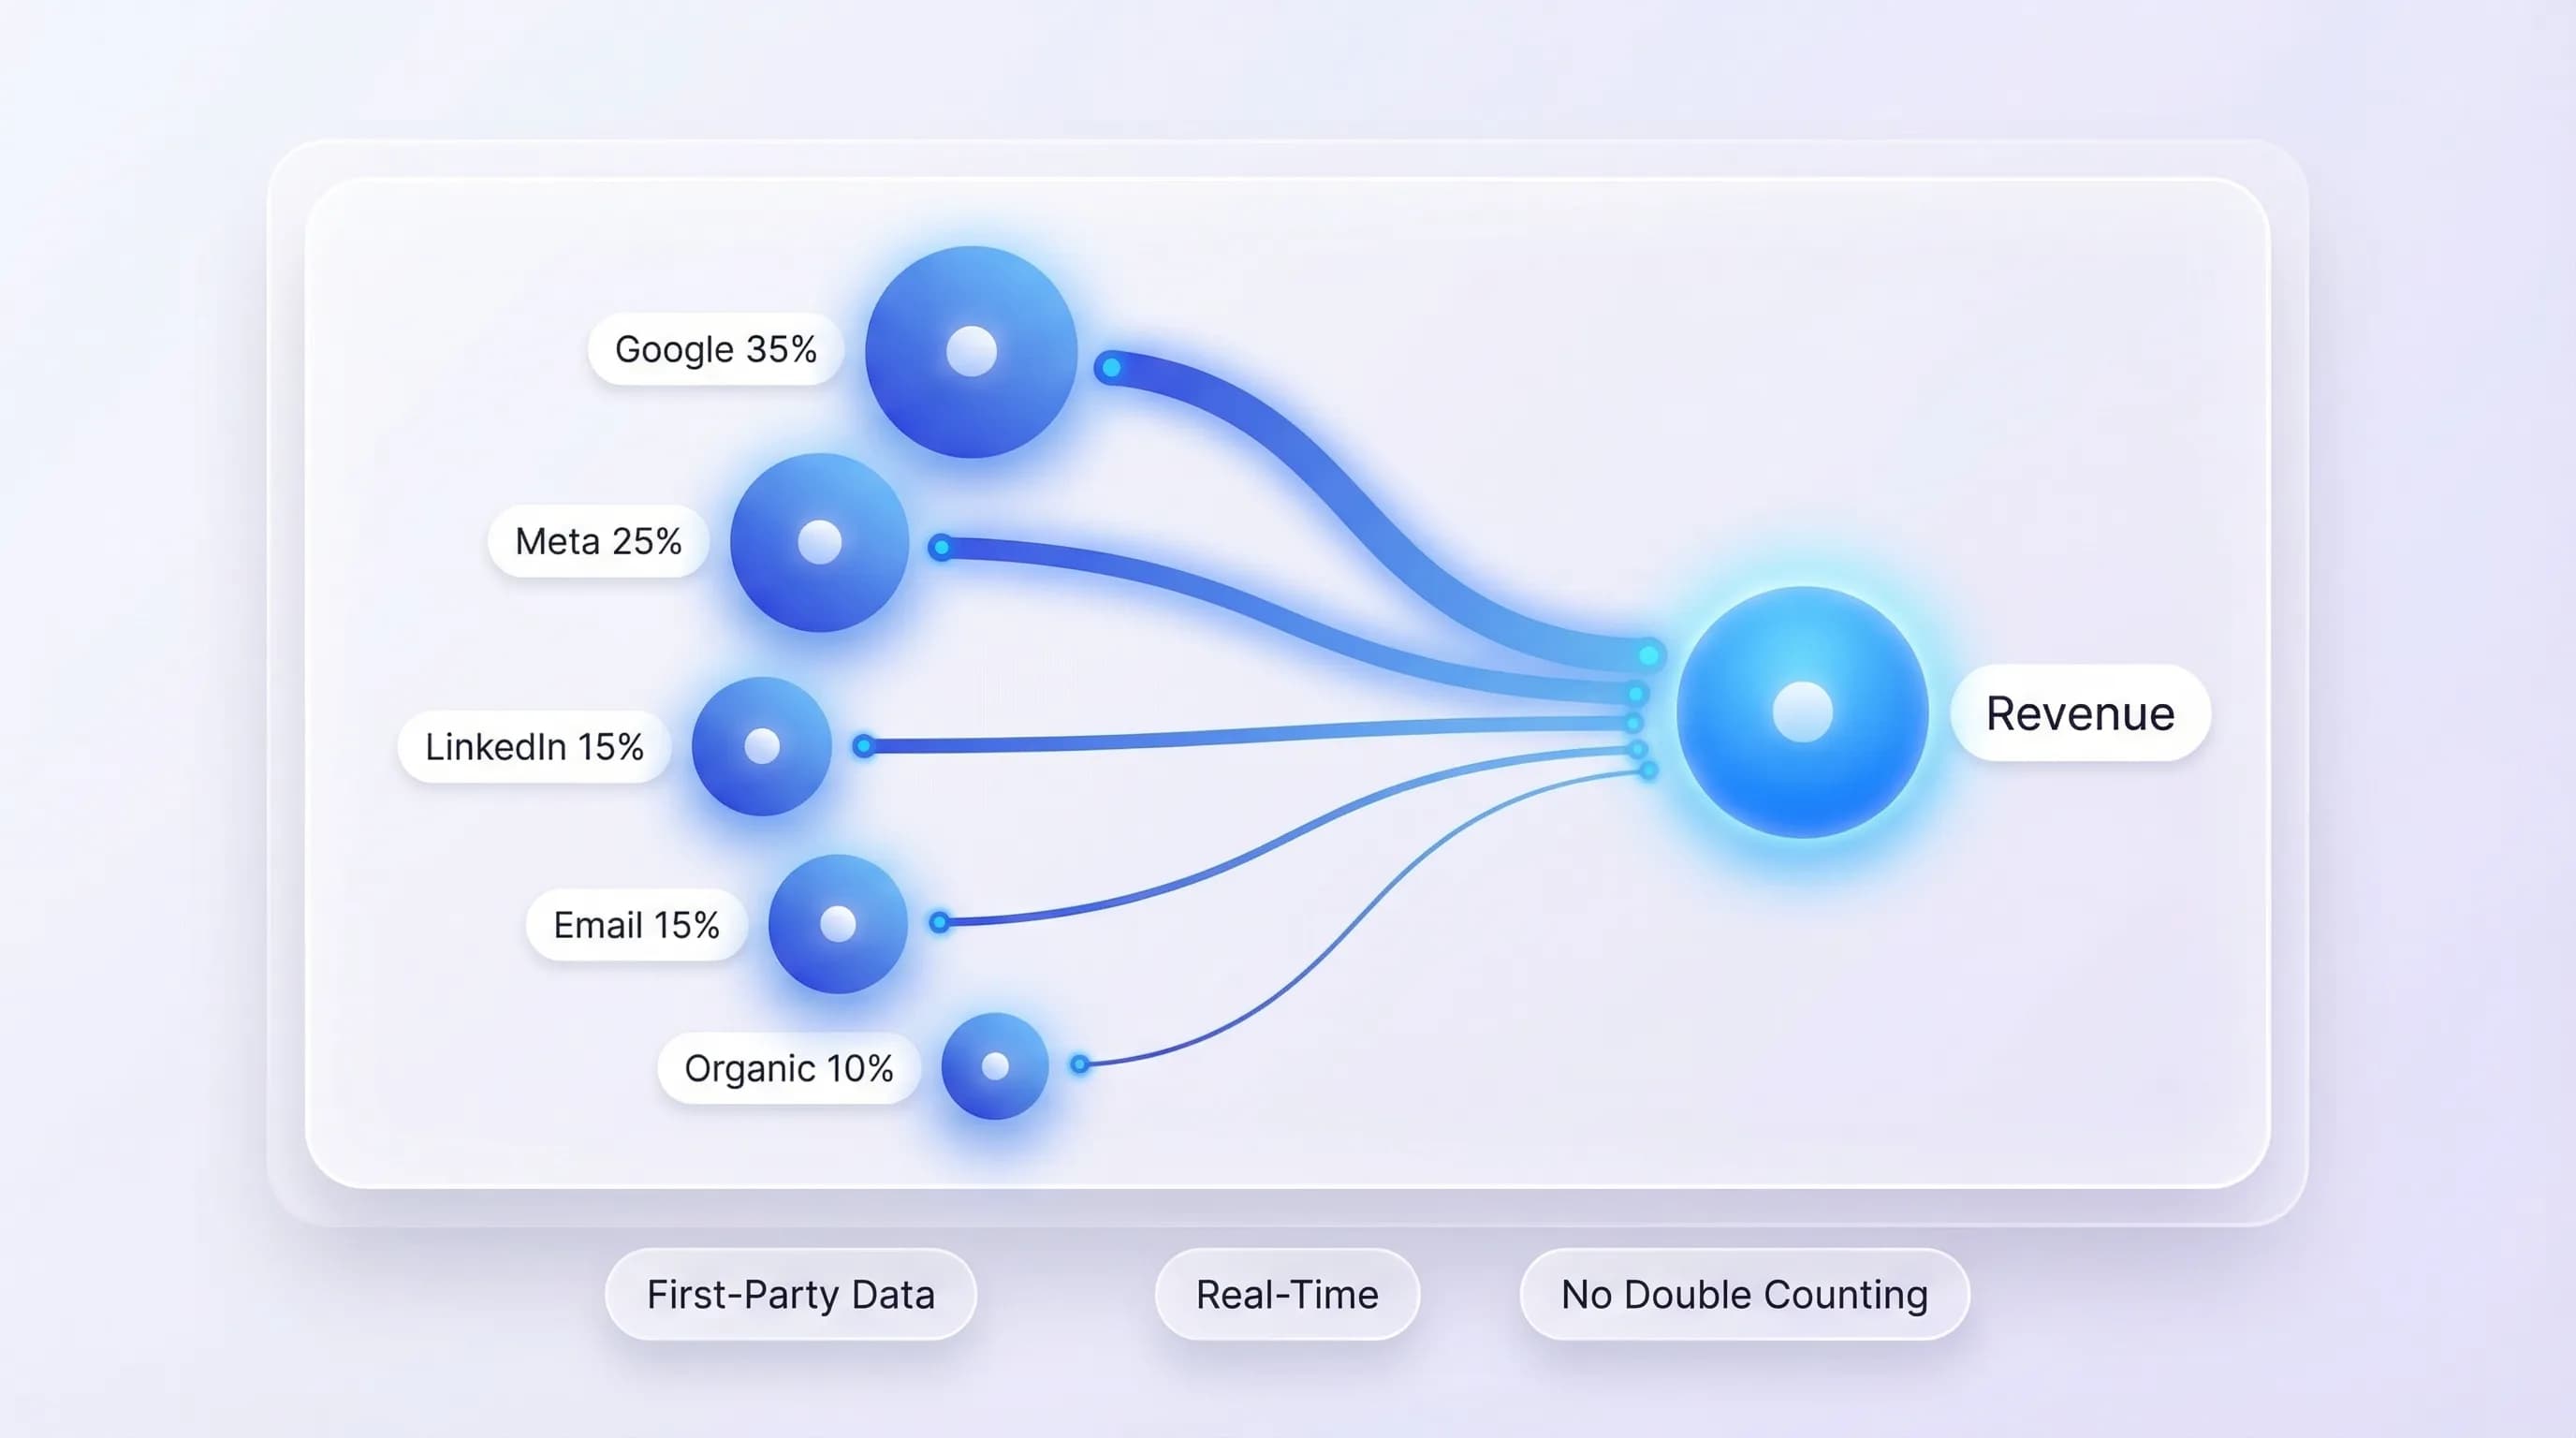
See where every dollar of revenue actually comes from
ObserviX ties each channel to revenue using first-party data. See actual ROAS for Google Ads, Meta, Email, LinkedIn, and Organic — side by side. Drill into any channel to compare spend versus attributed revenue. Run all six attribution models simultaneously. Google Ads might get 45% credit under last-touch but only 18% under first-touch. The patterns reveal which channels open, which close, and which do the heavy lifting in the middle.
- First-party ROAS per channel: Google, Meta, Email, LinkedIn, Organic
- Six attribution models running in parallel for instant comparison
- Drill-down from channel to campaign to individual touchpoint
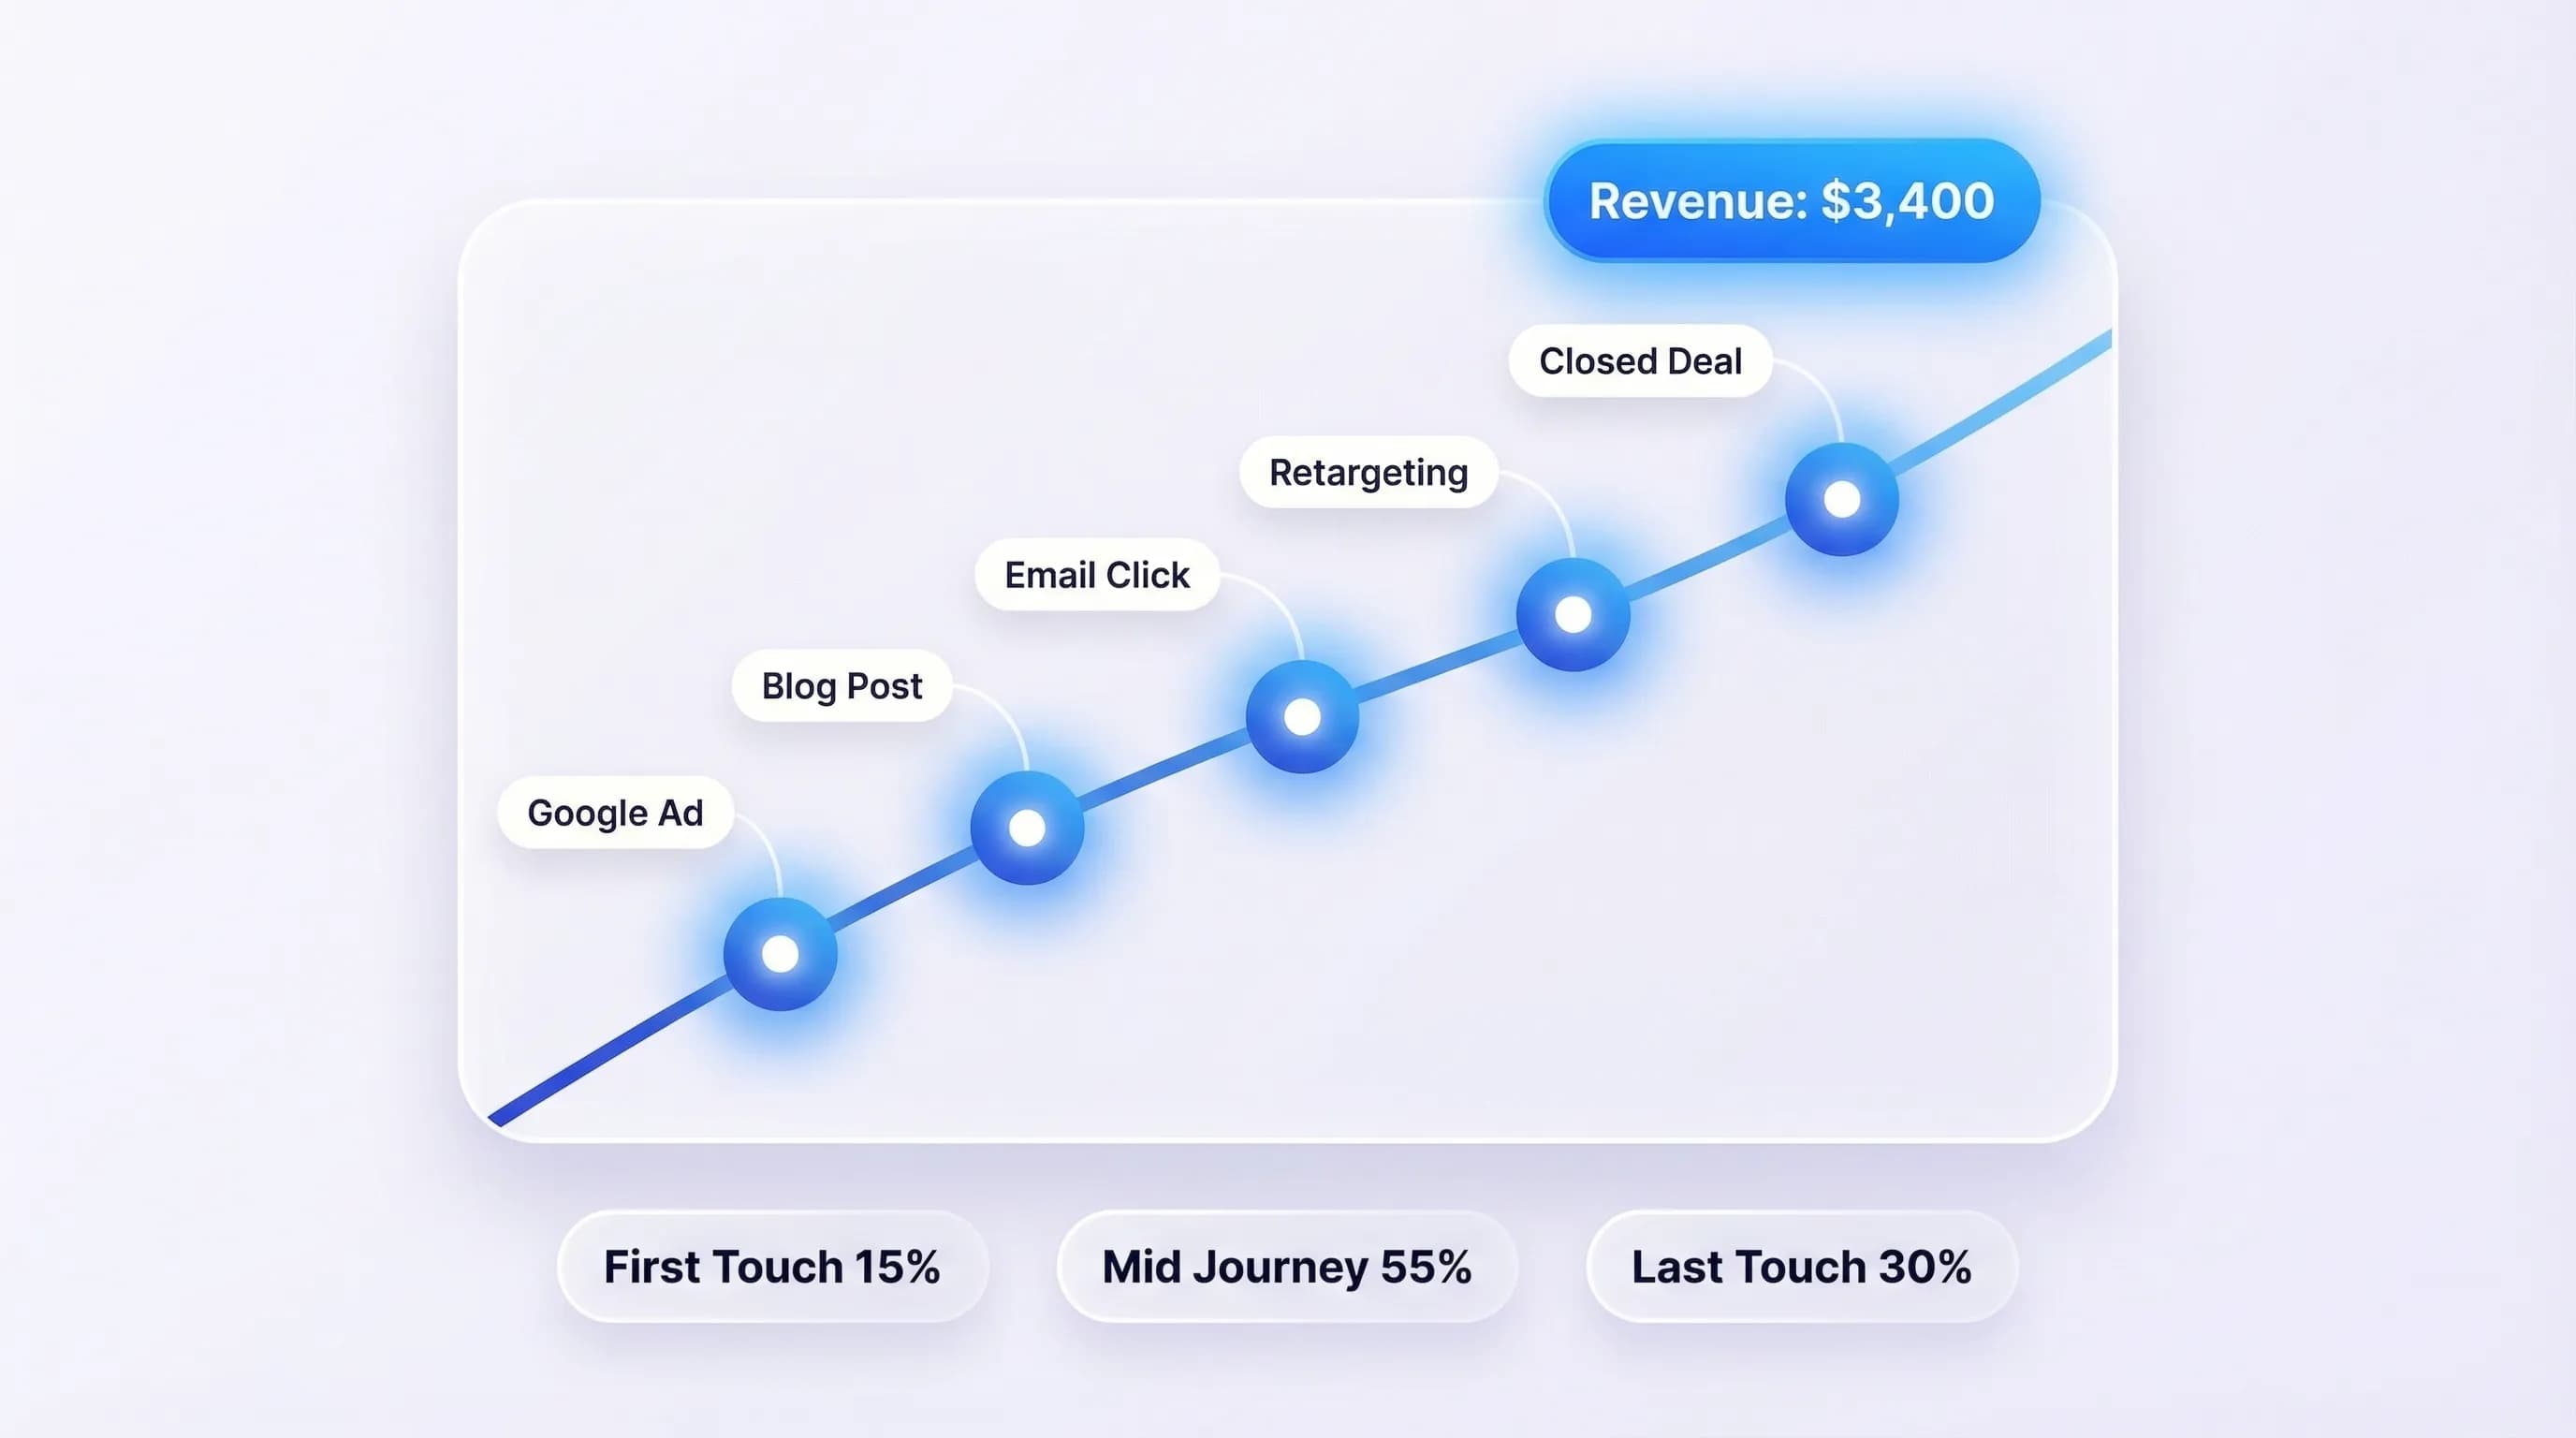
Track one customer across every device and session
A visitor clicks a Google ad on their phone. Reads your blog on a laptop. Opens your email on a tablet three days later and converts. Most tools see three separate visitors. ObserviX sees one. First-party identity resolution stitches sessions into a single journey — whether conversion takes 2 days or 90. No third-party cookies required.
- First-party identity resolution across sessions and devices
- Tracks journeys from 2 to 200+ days without third-party cookies
- No cookies, no ITP impact — compliant by design
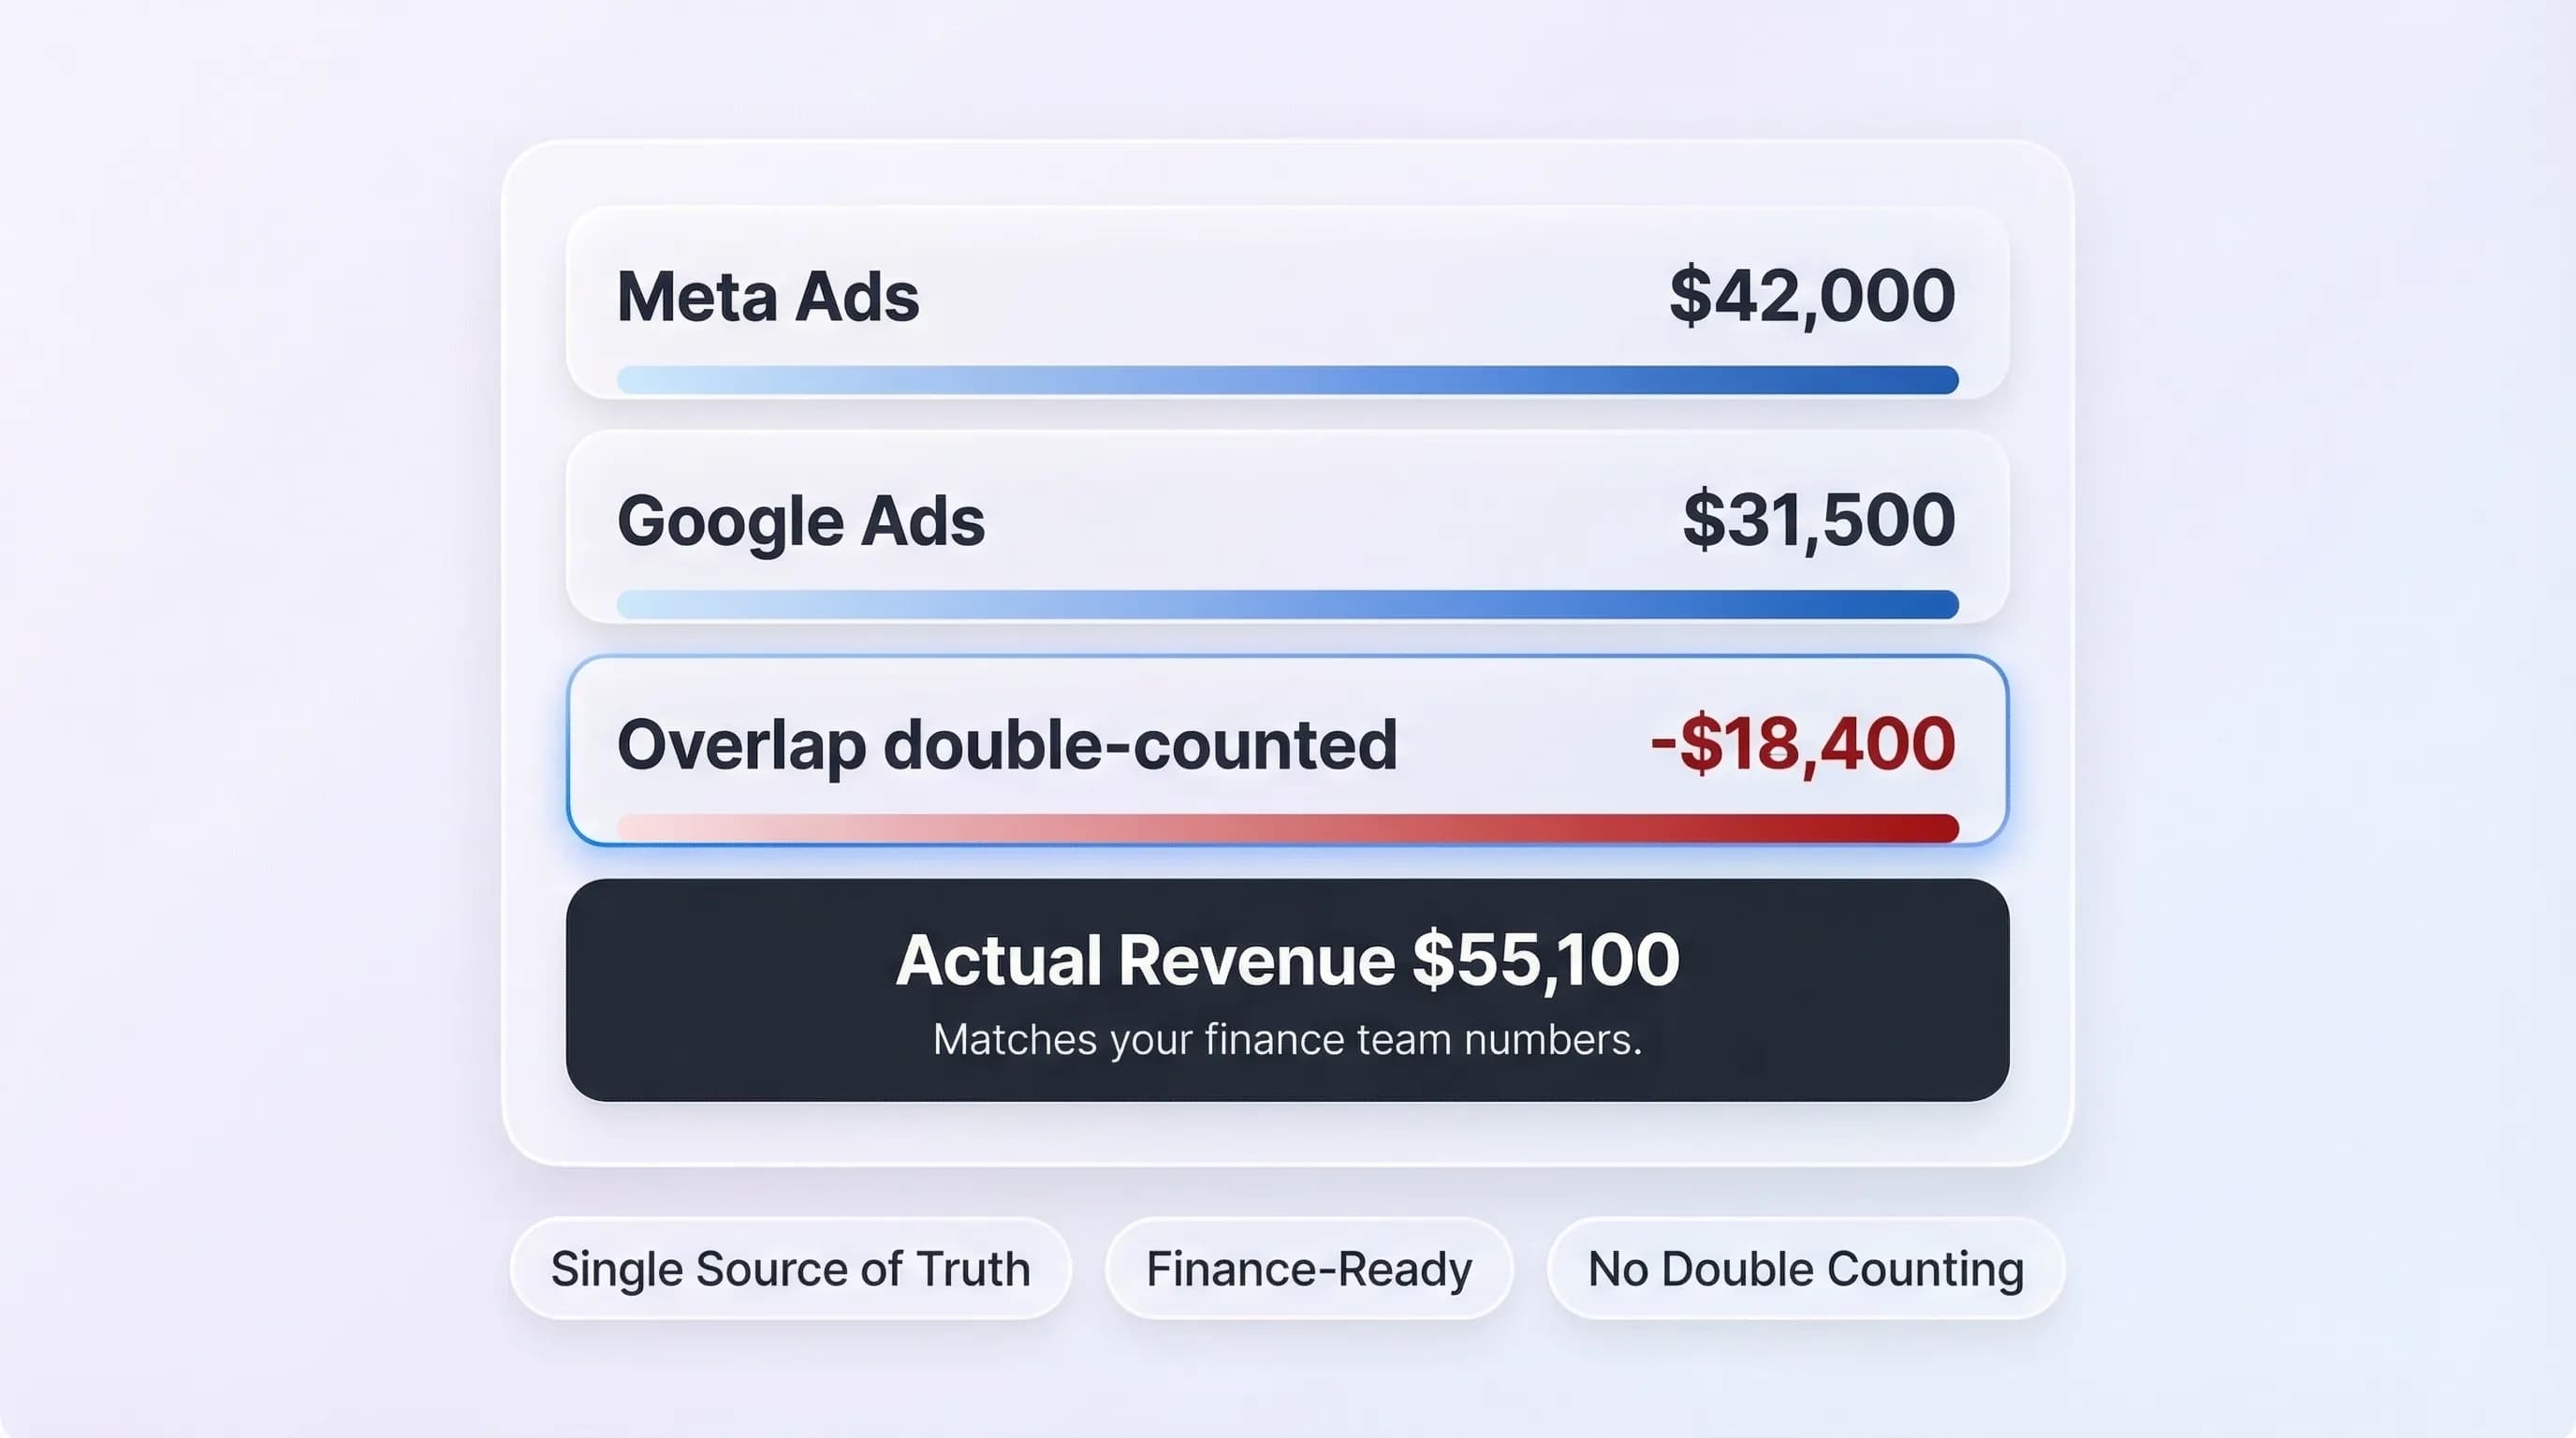
Stop double-counting revenue across platforms
Google says $31,500. Meta says $42,000. Your bank account shows $55,100. ObserviX deduplicates overlapping conversions and gives you a single source of truth that matches your finance team's numbers. One report answers 'is marketing working?' Total spend, attributed revenue, blended ROAS, revenue by channel. Share with your CEO or board via a single link.
- Deduplication of conversions claimed by multiple platforms
- Single blended ROAS that matches your actual revenue
- Shareable board-ready report via a single link
Six attribution models. Pick the one that fits your business.
Each model reveals a different truth. Run all six simultaneously and compare in one click.
- Simple
First-Touch
All credit to the first interaction. See which channels generate awareness.
Use when:Filling top of funnel - Simple
Last-Touch
All credit to the final interaction. See which channels close deals.
Use when:Short buying cycles - Multi-Touch
Linear
Equal credit to every touchpoint. No bias. See your full funnel.
Use when:Getting started - Multi-Touch
Time-Decay
More credit to recent interactions. Ideal for longer sales cycles.
Use when:B2B or 30+ day cycles - Multi-Touch
Position-Based
40% first, 40% last, 20% middle. Balanced acquisition + conversion view.
Use when:Valuing openers and closers - AI-PoweredMost Accurate
AI-Driven
ML assigns credit from your actual conversion patterns. Most accurate model.
Use when:You have 30+ days of data
Start in three steps
Three steps. No developer needed. First attribution report within 24 hours.
Install the ObserviX Pixel
One script on your site. Under 5 minutes on Shopify, WordPress, WooCommerce, or any platform. Captures every interaction using first-party data.
Pick your attribution models
Run all six simultaneously or choose specific ones. Rule-based models work instantly. AI-driven learns from your data in 30 days.
See attributed revenue
Your dashboard shows revenue by channel, campaign, and touchpoint. Compare models. Export to PDF or CSV. Make data-backed budget decisions.

"We kept increasing Meta spend because last-click said it was our best channel. Multi-touch showed Email and Organic were doing the heavy lifting. We moved $18K/month to email sequences. ROAS went from 2.4x to 3.8x in eight weeks."

Daniel Kramer
Head of Growth, DTC Health & Wellness Brand
Questions answered
ObserviX uses first-party data (not third-party cookies), ties attribution to actual revenue (not just conversion counts), and lets you compare six models side by side. GA4 defaults to data-driven with limited flexibility. Your data stays on your infrastructure, not Google's.
Start with Linear (equal credit, no bias) or Position-Based (emphasizes first and last touch). After 30 days, enable AI-Driven for the most accurate distribution based on your actual conversion patterns.
Yes. ObserviX uses a first-party pixel on your domain. It's not blocked by ad blockers, ITP, or iOS App Tracking Transparency. Your data stays complete even as third-party cookies disappear.
Yes. ObserviX tracks journeys from 2 days to 200+. Cross-session identity resolution stitches every interaction into one journey. Integrates with HubSpot and Salesforce to include offline touchpoints like sales calls.
Install the Pixel in under 5 minutes. Rule-based models work immediately. First attribution report within 24 hours. AI-driven model needs 30 days of conversion data to produce reliable results.
Google Ads, Meta, LinkedIn, TikTok, Email platforms, Shopify, WooCommerce, HubSpot, Salesforce, and any source using UTM parameters. No CSV uploads or manual tagging beyond standard UTMs.
See what last-click has been hiding
Start your 14-day free trial and make data-driven decisions