See the complete path from first click to conversion
Visual timelines that connect every ad click, page view, email open, and return visit into one continuous story. No SQL. No BI tools. No guessing.
Move your most important metrics with ObserviX
Average touchpoints tracked per customer journey
Faster identification of winning conversion paths
Saved per week on manual journey analysis
Average conversion rate improvement after optimizing
You can see traffic. You can see sales. The middle is a black box.
GA4 shows page views. Meta shows ad clicks. Your email platform shows opens. Shopify shows orders. Meanwhile, your funnels assume customers follow the path you designed — but they browse, leave, come back days later from a different device, and convert through a retargeting ad. When leadership asks which channel drives growth, you open four dashboards and still can't give a confident answer.
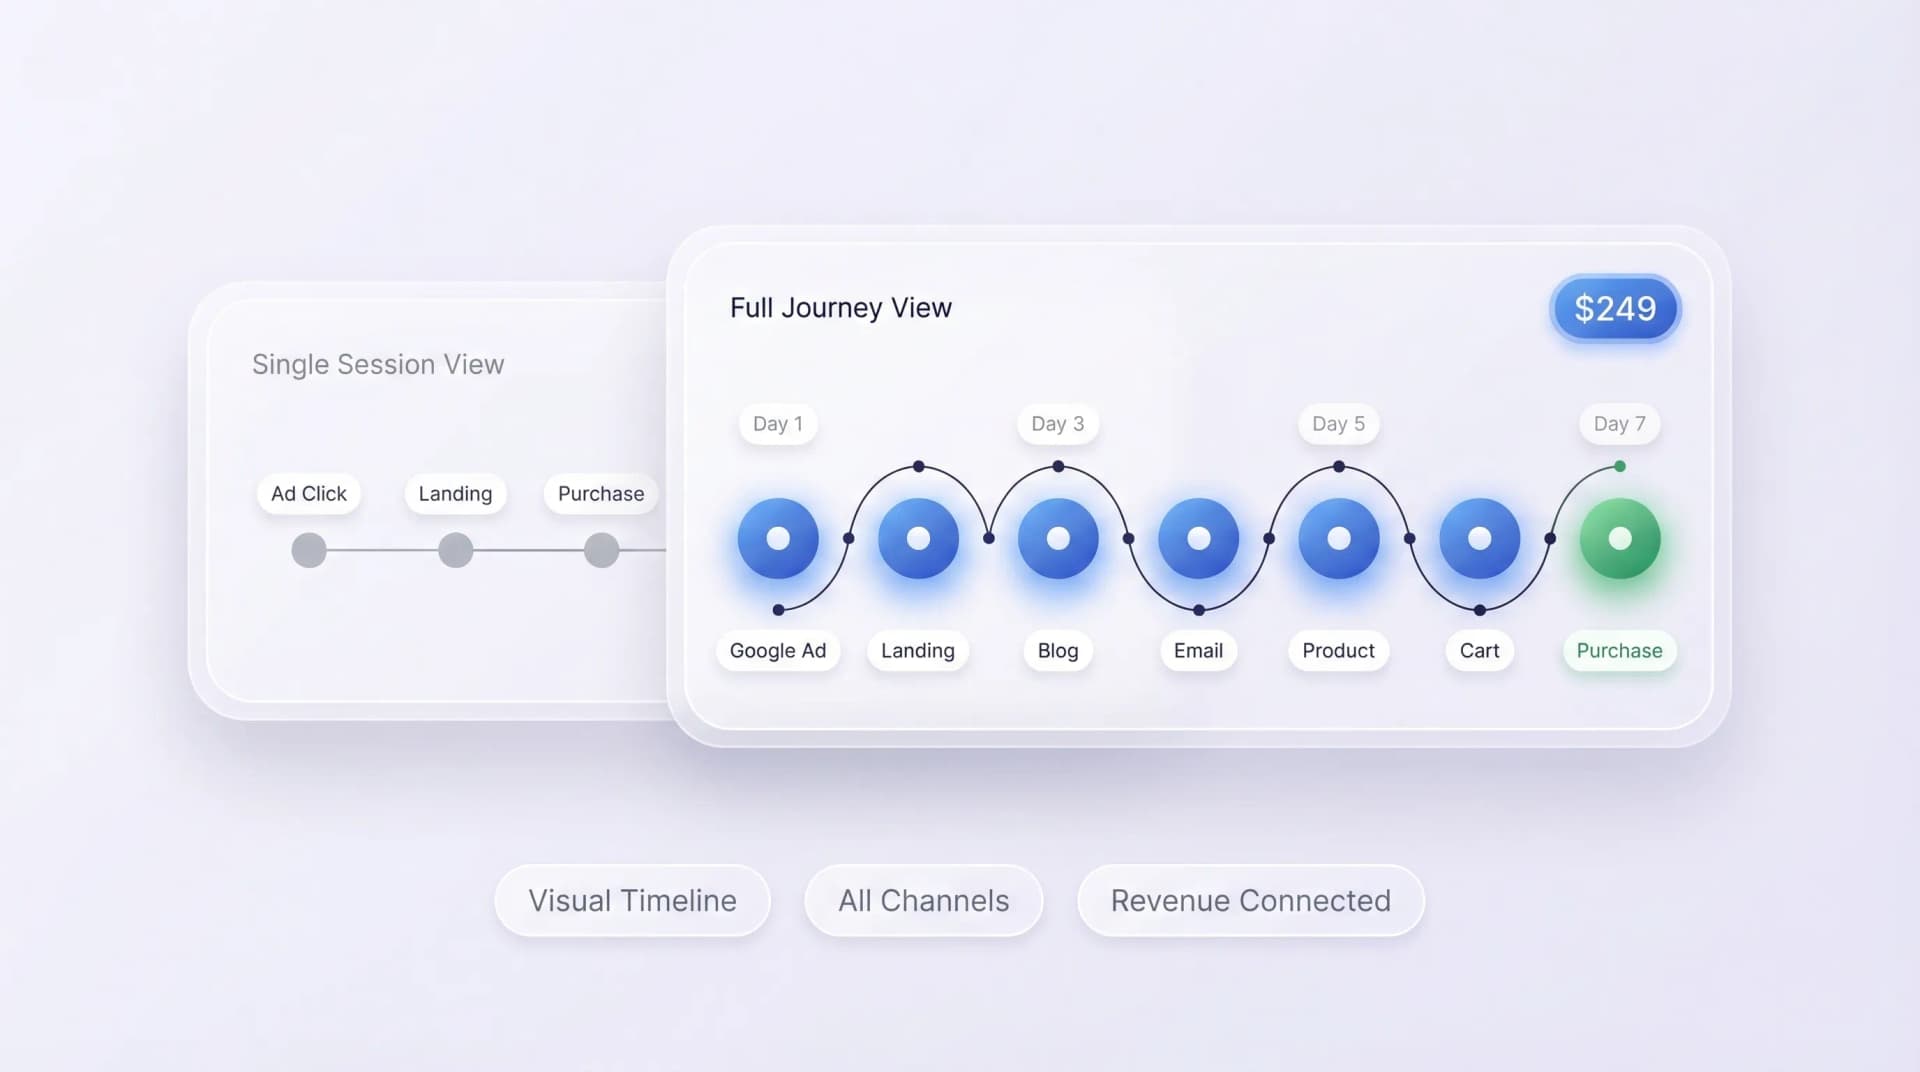
ObserviX maps the complete journey — every session, channel, and device in one visual timeline.

Track one visitor across every session, channel, and device
A visitor clicks a Facebook ad on mobile, browses your blog on desktop the next day, and converts through an email link a week later. Most tools see three anonymous sessions. ObserviX sees one visitor. First-party identity resolution stitches these fragments into a single journey — whether conversion takes 2 days or 90. No third-party cookies required.
- First-party identity resolution across sessions and devices
- Tracks journeys from 2 to 200+ days without third-party cookies
- Single unified timeline per visitor, not disconnected sessions

Find where visitors drop off and fix the leaks
Every funnel has leaks. ObserviX highlights the exact pages and transitions where potential customers disengage. See which landing pages have high entry rates but low progression. Identify checkout steps where abandonment spikes. Compare drop-off rates between segments — paid vs. organic, mobile vs. desktop, new vs. returning. Answer these questions in clicks, not queries.
- Exact page-level drop-off detection with abandonment rates
- Segment comparison: paid vs. organic, mobile vs. desktop
- Checkout step analysis to pinpoint conversion leaks
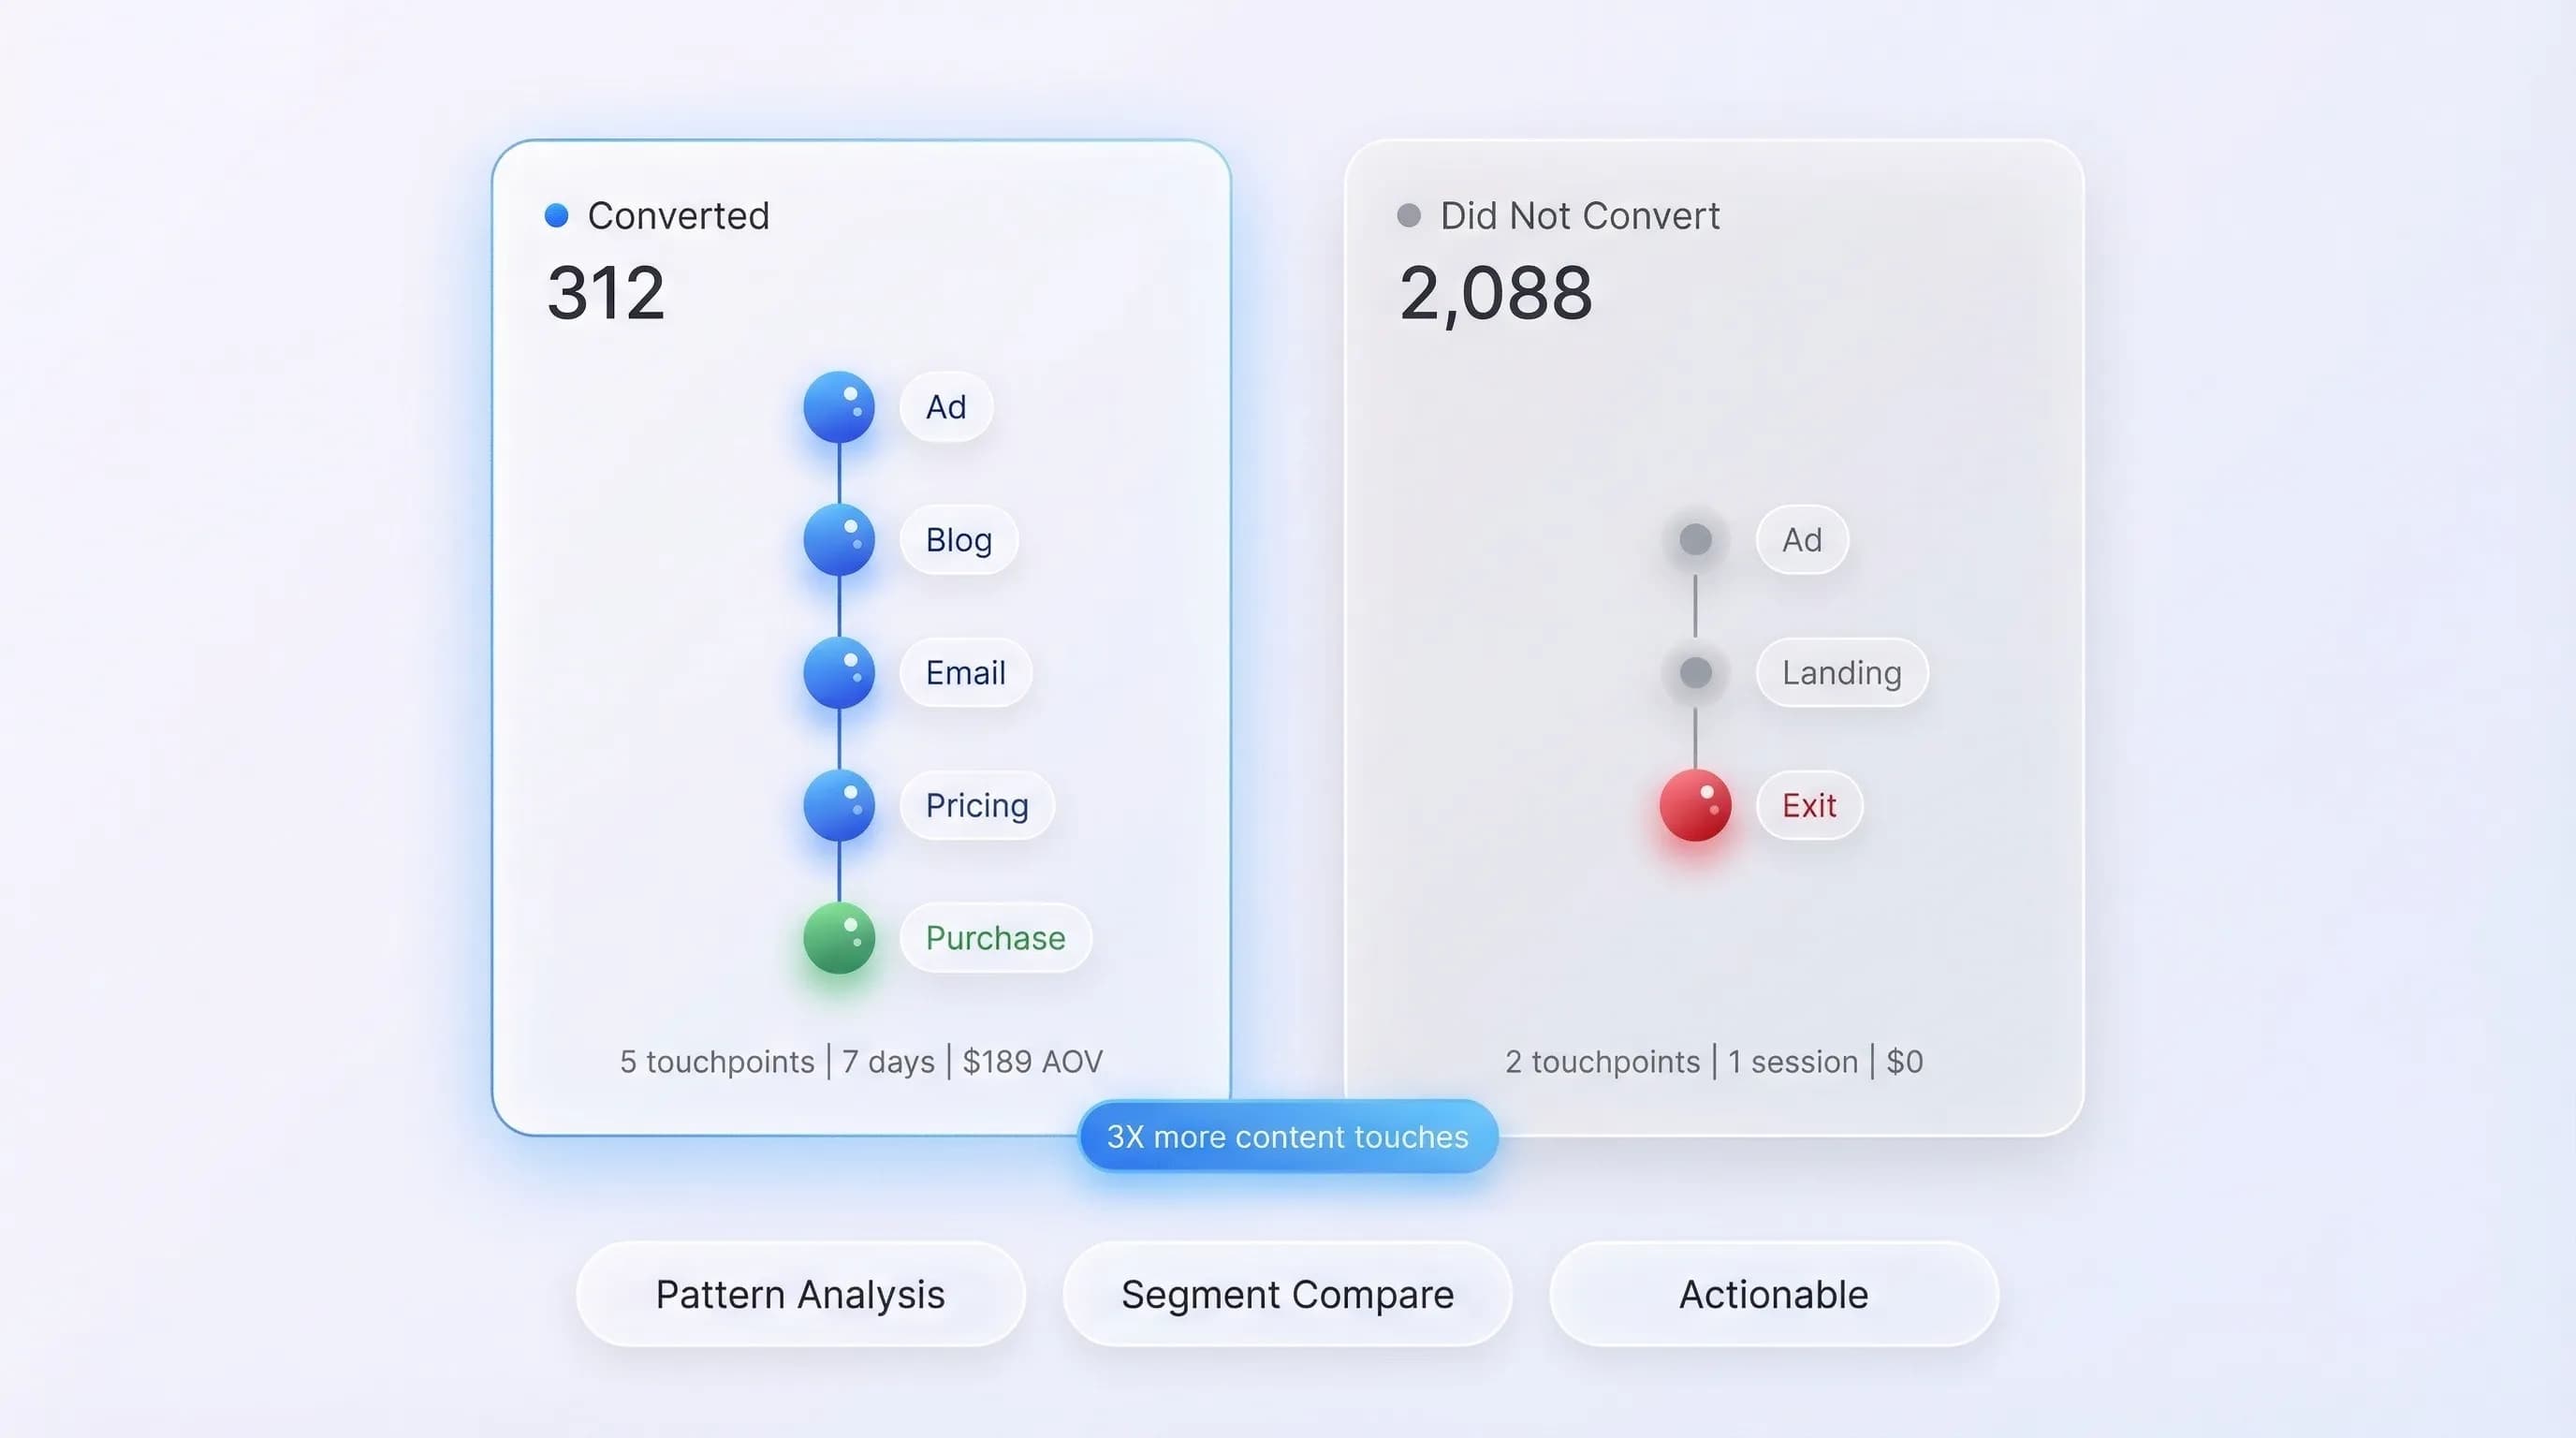
Compare winning journeys to lost opportunities
Side-by-side comparison shows the exact difference between visitors who convert and those who don't. Discover which content appears in successful journeys but is missing from failed ones. See the optimal number of touchpoints before conversion. Pattern analysis across thousands of journeys reveals what works at scale. Use these insights to redesign funnels, reallocate budget, and create content that fills gaps in your conversion paths.
- Side-by-side converted vs. non-converted journey comparison
- Content gap analysis — what converts vs. what doesn't
- Pattern recognition across thousands of journeys at scale
Real journeys. Real patterns. Real revenue.
Every business has a different path to conversion. ObserviX maps them all.
7-Day Purchase Journey
Instagram Ad → /summer-collection → Browsed 3 products
Google Search → /blog/review → /sizing-guide
Email "Items selling fast" → Added to cart → Abandoned
Meta Retargeting → /cart recovered → Purchase $189
Insight: Last-click credits Retargeting with 100%. ObserviX shows Instagram (30%), SEO (20%), Email (25%), Retargeting (25%).
45-Day Sales Cycle
Organic Search → /blog/attribution-guide → Read 4 min
LinkedIn Ad → /solutions/b2b-saas → /pricing (twice)
Direct → /case-studies → Downloaded B2B Playbook (MQL)
Email Nurture → Opened 3/5 emails → Booked Demo (SQL)
Direct → /pricing (3rd visit) → Contract $3,600/yr
Insight: Last-click credits Direct. ObserviX shows Organic (20%), LinkedIn (20%), Content (25%), Email (20%), Direct (15%).
Start mapping journeys in three steps
Three steps. No developer needed. Journey data appears within 24 hours.
Install the ObserviX Pixel
One script on your site. Under 5 minutes on Shopify, WordPress, WooCommerce, or any platform. Captures every interaction using first-party data.
Define your conversion goals
Tell ObserviX what counts — purchases, sign-ups, demo requests, downloads. Use the visual Event Manager to map events without writing code.
See your first journey maps
Journey timelines populate as sessions are captured. Within 24-72 hours, you'll see cross-session patterns and your first drop-off points.

"Before ObserviX, we had no idea what happened between first click and conversion. Now we can see the exact journey our best customers take — and we've redesigned our entire funnel around it. Conversion rate improved 34% in three months just by fixing the drop-off points ObserviX revealed."

David Reinholt
VP of Growth, E-Commerce Platform
Questions answered
Funnel reports show a fixed sequence you designed. Journey mapping shows the actual paths visitors take — including the steps you didn't plan for. Visitors rarely follow a linear path. They browse, leave, come back days later, and convert through unexpected channels. Journey mapping captures this real behavior.
The first-party Pixel maintains visitor identity across sessions and devices. When a visitor returns — even on a different device — ObserviX recognizes them and appends the new session to their journey. No third-party cookies. Privacy-compliant by design.
Journey maps show the path. Attribution assigns revenue credit to each touchpoint along that path. In ObserviX, they work together — every journey visualization includes attribution data showing which channels deserve credit for the conversion.
Yes. ObserviX tracks journeys from 2 days to 200+. The average journey spans 27+ touchpoints, but complex B2B journeys can exceed 50 touchpoints across multiple weeks. Cross-session identity resolution works regardless of journey length.
Individual session paths appear immediately. Cross-session journeys build as visitors return — typically 24-72 hours for initial patterns. Within a week, you'll see statistically meaningful conversion paths.
Yes. ObserviX uses first-party data collection only. The Pixel runs on your domain. Visitor identity resolution uses anonymized identifiers — no personal data is shared with third parties. You control data retention and can configure EU or US data processing.
Stop guessing what happens between first click and conversion
Start your 14-day free trial and make data-driven decisions