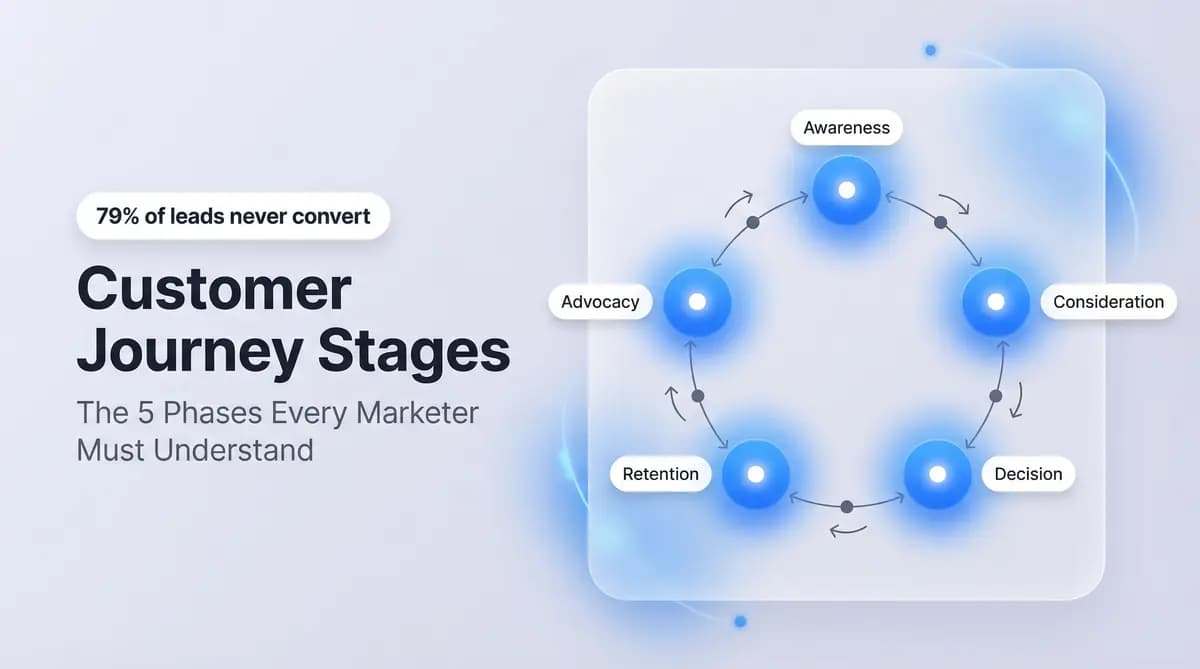
Customer Journey Stages: The 5 Phases Every Marketer Must Understand
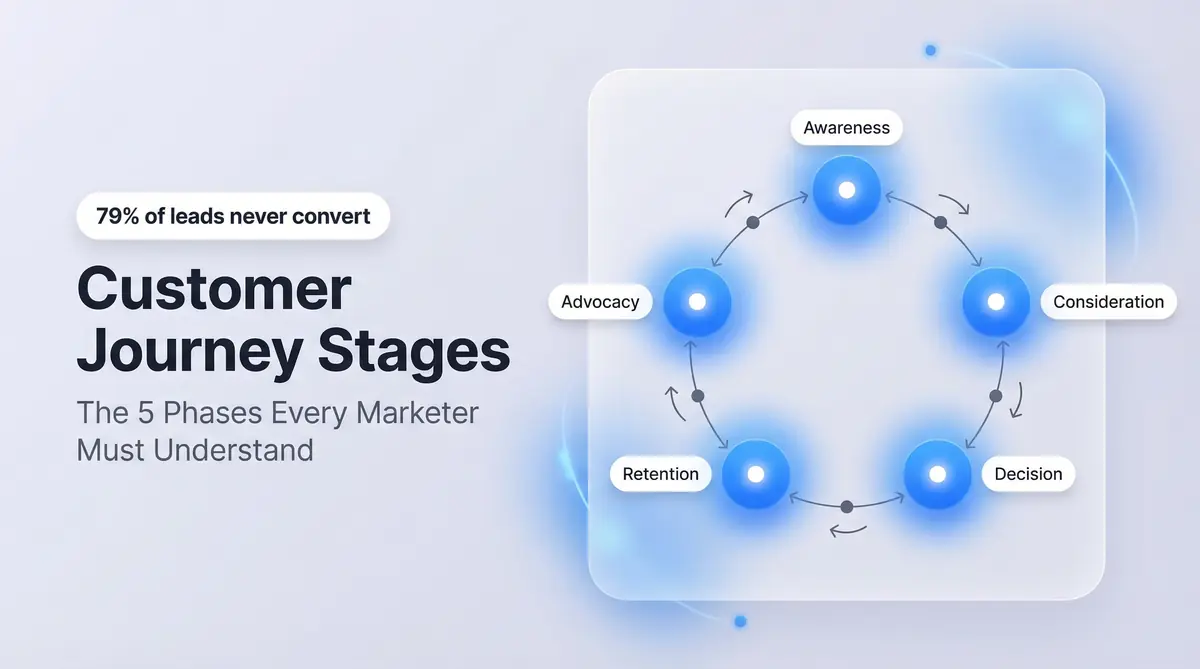
79% of acquired leads never convert. That's not a rounding error—it's the single most expensive gap in modern marketing. And it rarely happens because the product is bad or the price is wrong. It happens because marketers treat the customer journey as a straight line when it's anything but.
Your buyers don't move predictably from ad click to purchase. They research anonymously for months, loop back to compare options, consult peers, stall at checkout, and sometimes don't buy until weeks after you've written them off. If your marketing ignores the stages of that journey, you're optimizing the wrong things at the wrong time.
Sound familiar? Most teams are investing heavily in acquisition while the real leak is somewhere else entirely.
This guide breaks down the five core customer journey stages: what happens at each one, why it matters, and how to optimize it.
What Are Customer Journey Stages?
Customer journey stages are the distinct phases a buyer moves through—from first learning about a problem to becoming a loyal advocate for the brand that solved it.
The core goal? To understand where your buyers are mentally and emotionally so you can show up with the right message, at the right time, through the right channel.
The most widely adopted framework uses five stages: Awareness, Consideration, Decision, Retention, and Advocacy. McKinsey research across 20,000 consumer interviews confirmed something critical: the journey isn't a linear funnel. It's a loop. Buyers cycle back, re-evaluate, and restart—especially in B2B environments.
Think of it this way. A buyer who attended your webinar last quarter didn't convert. Six months later, they're back comparing you to a shortlisted competitor. They never left your consideration stage. They just went invisible. Stage frameworks help you plan for that.
Every stage has distinct psychology, distinct channels, and distinct success metrics. Treating them as one funnel is the most expensive mistake in customer journey marketing.
Why Customer Journey Stages Matter
The gaps between stages are where revenue leaks out. The data makes this concrete.
81% of B2B buyers already have a preferred vendor in mind before they ever contact sales (McKinsey 2025). That preference was built entirely during anonymous research most marketers never see. If you're not building authority in Awareness and Consideration, you're losing before the conversation starts.
Buyers who receive stage-appropriate nurturing make 47% larger purchases than those who don't. Consideration-stage content—comparison guides, case studies, ROI tools—directly increases deal size. This isn't about more emails. It's about the right information at the right moment.
Retention costs 5x less than acquisition. Yet most marketing budgets skew heavily toward top-of-funnel spend. Understanding that Retention is a distinct stage with its own tactics and KPIs is what separates companies that grow efficiently from those that churn their way to stagnation.
73% of consumers engage across six or more touchpoints before purchasing (Gartner 2025). Without a stage framework, coordinating messaging across those touchpoints is guesswork. With one, every channel—paid, organic, email, sales—is calibrated to where the buyer actually is.
The 5 Customer Journey Stages: Deep Dive
Stage 1: Awareness
The buyer has identified a problem or need. They're not yet looking for your specific product—they're searching for understanding. Blog posts, organic search, social content, and thought leadership earn their keep here.
The key question: are you visible before they even know to search for you?
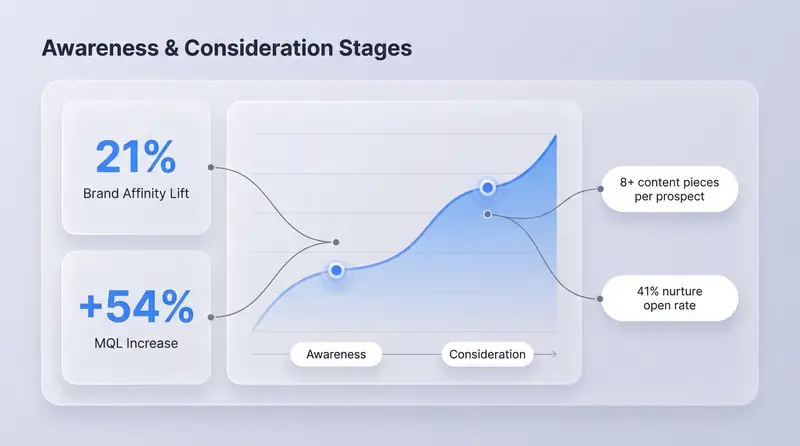
Dove's Real Beauty campaign generated a 21% increase in brand affinity and 11.9% sales growth by leading with a resonant message before asking for anything. Apple's "Shot on iPhone" produced 6.5 billion impressions and 24 million Instagram mentions—customers sharing their experience, not paid placement. Neither looked like traditional advertising. Both built enormous Awareness equity.
Key metrics:
| Metric | Benchmark | Top Performers |
|---|---|---|
| Awareness-to-lead conversion | 1-7% | 8-15% |
| Brand lift (paid campaigns) | 12-15% | 20-27% |
| Branded search volume growth | Baseline | +15% QoQ |
| Organic search traffic (non-branded) | Baseline | Track separately |
Invest in SEO content targeting problem-aware search terms, not just product-aware ones. "How to reduce customer churn" is an Awareness-stage query, not a buying signal. Track non-branded organic traffic growth as the leading indicator.
Stage 2: Consideration
The buyer knows what kind of solution they need. Now they're evaluating options—reading comparison articles, watching demos, downloading guides, talking to peers. Here's what surprises most marketers: 60% of the purchase decision is often already made before a salesperson gets involved.
They want evidence. Specificity. Social proof. In B2B, they're building a business case for 6.8 stakeholders simultaneously—each with different concerns, different objections, different definitions of "good enough."
After integrating HubSpot and Salesforce to unify journey tracking, Jedox saw:
- +54% increase in MQLs
- +24% increase in website traffic
- Sales cycle reduced from 75-130 days to 60-110 days
The MQL lift wasn't from more traffic. It came from better conversion of existing traffic through stage-appropriate nurturing. Better consideration-stage content meant buyers arrived at sales conversations more informed—and faster to commit.
Key metrics:
| Metric | Benchmark | Top Performers |
|---|---|---|
| MQL-to-SQL conversion | 13-20% | 20-25% |
| Content consumption per prospect | 1.8 pieces | 8+ pieces |
| Demo request rate | 2-5% of MQLs | 10-15% |
| Lead nurturing open rate | 27% | 41% |
Build comparison and evaluation content. Score leads by behavior—a buyer who downloaded your pricing guide three times is further along than one who opened a newsletter. Behavioral signals beat demographics.
Stage 3: Decision
The buyer has narrowed to a short list—usually two or three options. They're evaluating proposals, negotiating terms, building internal consensus. In B2B, this involves 6.8 stakeholders across a 10.1-month buying cycle (6sense 2025). Every stakeholder has a different concern. Every concern needs a different piece of content.
What's the question every buyer is silently asking? "Can I trust this solution with my budget and reputation?"
Flos USA traced their problem to a specific friction point: checkout abandonment. Buyers were reaching the decision stage with genuine purchase intent, then disappearing. The fix wasn't more traffic—it was removing friction at the decision moment. Fewer steps, trust signals, improved mobile UX.
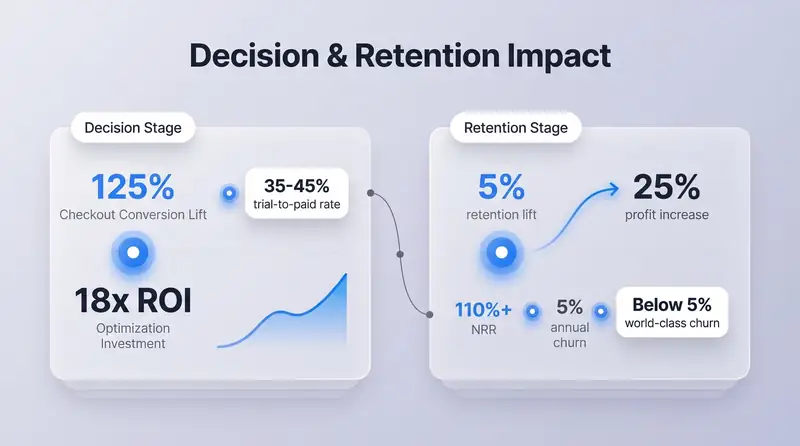
Results: 125% increase in checkout conversion rate and an 18x ROI on the optimization investment.
Key metrics:
| Metric | Benchmark | Top Performers |
|---|---|---|
| Demo-to-close rate | 22-30% | 35-45% |
| Trial-to-paid conversion | 15-25% | 35-45% |
| eCommerce conversion rate | 2-3% | 8%+ |
| Personalized vs. generic CTA lift | +202% | Personalize all CTAs |
Source: Gartner 2025 Sales Conversion Benchmark (N=800 companies); Baymard Institute Cart Abandonment Study
Remove friction at every step. Slow demo scheduling, complex pricing pages, and generic proposals cost you deals that were already yours to lose. The CFO cares about ROI. The end user cares about ease of use. The IT director cares about integration. One generic deck serves none of them.
Stage 4: Retention
The buyer has become a customer. The journey doesn't end here—it deepens. This is where most companies lose the long-term value they worked to acquire.
A 5% improvement in customer retention increases profits by 25% (Bain & Company). A 1% reduction in monthly churn translates to a 10-30% increase in customer lifetime value. Not marginal gains. Compounding advantages that grow every quarter.
One telecommunications company identified that 26.54% churn was putting $16.06M in annual revenue at risk across 1,869 customers. By building an ML churn prediction model using 15 data sources, they improved prediction accuracy 2.5x and protected the at-risk revenue. The fix wasn't a new acquisition campaign—it was understanding the Retention stage deeply enough to intervene before customers left.
Key metrics:
| Metric | Benchmark | World-Class |
|---|---|---|
| Annual churn rate (SaaS) | 8-15% | Below 5% |
| Net Revenue Retention (NRR) | 95-100% | 110%+ |
| CSAT score | 78% | 88%+ |
| Churn prediction accuracy | Reactive | 85-90% |
| Proactive outreach rate | 45% | 78%+ |
Source: ChurnZero 2025 Customer Success Benchmark (N=2,000 SaaS companies)
Nail onboarding. The first 30 days predict long-term retention more reliably than any other period. Monitor usage data proactively. A customer who hasn't logged in for 14 days is at risk. One who just hit a usage milestone is a candidate for an upsell conversation.
Stage 5: Advocacy
A retained, satisfied customer becomes a promoter. They recommend you to peers, leave reviews, participate in case studies, and defend your brand in conversations you're not part of. 81% of buyers trust peer recommendations over brand messaging—which means your advocates are doing top-of-funnel work at zero acquisition cost.
What advocates need isn't complicated. Recognition. Easy ways to share their experience. Referral programs, co-marketing opportunities, community membership—all of these activate advocacy.
Key metrics:
| Metric | Benchmark | Target |
|---|---|---|
| Net Promoter Score (NPS) | 30-40 | 50+ |
| Referral-sourced pipeline % | 5-10% | 20-30% |
| Case study participation rate | 1-3% of customers | 8-12% |
| Review site rating (G2, Capterra) | 4.0-4.2 | 4.5+ |
| Advocacy program ROI | 1.5-2x | 3.0x+ |
Source: Influitive 2025 B2B Advocacy Benchmark (N=2,800 companies)
Don't wait for advocacy to happen organically. Flag NPS promoters (score 9-10) within 72 hours. Build tiered participation pathways: review request, case study, reference call, co-marketing. Satisfied customers don't automatically become advocates. Activated customers do. The difference? A structured invitation to participate.
Common Mistakes to Avoid
Mistake 1: Treating the Journey as Linear
The most common error is assuming buyers move neatly from Stage 1 to Stage 5. McKinsey's research confirmed the journey is circular—buyers return to Consideration after seeing a competitor's ad, restart Awareness after a budget change, re-evaluate after a product update. Entirely predictable if you're watching for it.
The fix: Design your marketing for re-entry at any stage. Email sequences, retargeting, and content archives should accommodate buyers who aren't starting from scratch. Map actual customer paths and build workflows for each re-entry scenario.
Mistake 2: Neglecting Post-Purchase Stages
Most marketing teams invest 70-80% of budget in Awareness and Consideration, then treat Retention and Advocacy as "customer success problems." Category error. Those stages directly feed future Awareness by generating peer recommendations—and 81% of buyers trust peers over brand messaging.
The fix: Assign explicit ownership, budget, and KPIs to Retention and Advocacy. Measure CLV, churn, and referral rate with the same rigor you apply to CAC and MQL volume. Allocate at least 30% of marketing investment to post-purchase stages.
Mistake 3: Using Stage-Mismatched Content
Sending a product demo to someone who just discovered your category exists is like proposing on a first date. Sending a top-of-funnel blog post to a buyer already in contract review wastes their time—and yours.
The fix: Tag your content by stage and use behavioral signals—pages visited, content downloaded, emails opened—to serve the right content at the right moment. An MQL isn't sales-ready until they've engaged with Consideration-stage content.
Mistake 4: Running Awareness Campaigns Without Downstream Measurement
High reach with no downstream impact is an expensive vanity metric. Most analytics setups track conversions while Awareness and Consideration receive minimal measurement investment.
The fix: Attach downstream tracking to every awareness campaign. Measure branded search lift 30 and 60 days post-campaign. Use customer journey analytics to connect pre-conversion behavior to post-conversion revenue. If you only measure where deals close, you're optimizing the final 15% of the journey.
Mistake 5: Measuring Vanity Metrics at the Wrong Stage
Impressions don't matter at the Decision stage. Pipeline value doesn't matter at the Awareness stage. Wrong KPIs at the wrong stage mean optimizing for the wrong outcomes—then wondering why the funnel leaks.
The fix: Define stage-specific KPIs. Awareness gets brand lift and organic traffic. Consideration gets lead volume and content engagement. Decision gets conversion rate and deal velocity. Retention gets churn and CLV. Advocacy gets NPS and referral rate.
B2B vs. B2C: How the Journey Differs
The five stages apply to every business, but the dynamics inside each stage vary dramatically depending on whether you're selling to consumers or to businesses.
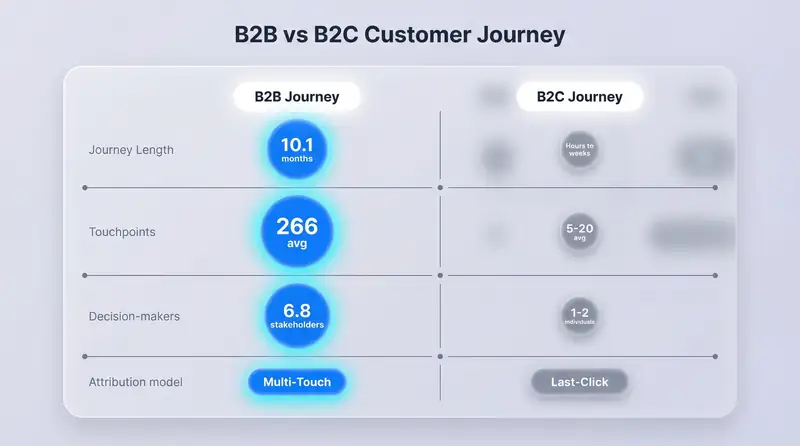
| Dimension | B2B Journey | B2C Journey |
|---|---|---|
| Average journey length | 10.1 months (6sense 2025) | Hours to weeks |
| Touchpoints to conversion | 266 average (McKinsey 2025) | 5-20 average |
| Decision-makers involved | 6.8 average (Gartner 2025) | 1-2 (mostly individual) |
| Primary Awareness channel | Organic search, peer referral, events | Social media, paid ads, influencers |
| Consideration driver | Case studies, ROI calculators, demos | Reviews, price, convenience |
| Decision trigger | Business case, stakeholder consensus | Urgency, social proof, easy checkout |
| Retention strategy | Customer success, expansion revenue, QBRs | Loyalty programs, personalization |
| Advocacy form | Referrals, case studies, analyst mentions | Reviews, social sharing, UGC |
| Key retention metric | Churn rate, NPS, Net Revenue Retention | Repeat purchase rate, LTV |
| Attribution model needed | Multi-touch (266 touchpoints demand it) | Last-click (acceptable for short cycles) |
| Funnel velocity | Slow (multi-month or multi-year) | Fast (can be same day) |
Source: Gartner 2025 B2B vs. B2C Buyer Journey Comparative Study; 6sense B2B Buyer Behavior Report 2025 (N=3,000)
The key implication for B2B marketers: you can't compress the journey. You can only optimize it. Rushing a buyer through Consideration with aggressive follow-up increases churn later—pressured buyers skip the steps that build product confidence. Build for the full 10 months, not the 30-day sprint.
Both B2B and B2C journeys are now predominantly self-directed. The buyer controls the pace, the channel, and the sequence. The marketer's job is to be present and valuable at every stage—not to push.
Key Takeaways
-
Five stages: Awareness, Consideration, Decision, Retention, Advocacy. Each requires different messages, channels, and metrics. One continuous sales push loses buyers at every transition.
-
79% of acquired leads never convert—and most losses are predictable with stage-specific conversion tracking. The fix is rarely more top-of-funnel spend. It's usually better Consideration-to-Decision nurturing or Decision-to-Retention onboarding.
-
B2B journeys average 10.1 months, 6.8 stakeholders, 266 touchpoints. Last-click attribution can't see this journey. Multi-touch models are table stakes.
-
Retention and Advocacy are the highest-ROI stages most teams underinvest in. A 5% retention improvement increases profits by 25%. Peer advocacy influences 81% of new buyer decisions. Both deserve real budget and ownership—not leftover resources.
-
The journey is circular, not linear. Buyers loop back, restart, and re-evaluate constantly. Design your marketing to support re-entry at any stage—and optimize for stage transitions, not just stage volume.
See Your Journey Stages Clearly
Understanding the five stages is step one. Knowing which stage your buyers are in—across every channel, at every moment—is where the real leverage is.
ObserviX connects your marketing data across touchpoints so you can see exactly where buyers enter, where they stall, and which stages are driving conversions. Learn how customer journey analytics translates stage-level insight into revenue decisions—then explore ObserviX to apply this framework to your own marketing data.